55. The molecular ion peak [M]⁺ of an analyte as measured by Electron Ionization Mass Spectrometry has an m/z of 149 and a relative abundance of 100%. The [M]⁺ has a relative abundance of 6.7% and the [M + 2]⁺ peak has a relative abundance of 5%. The abundance of the major isotope of H, C, N, O, and S are ¹H–100%, ¹²C–98.9%, ¹³C–1.1%, ¹⁴N–99.6%, ¹⁵N–0.4%, ¹⁶O–99.8%, ¹⁸O–0.2%, ³²S–95.0%, ³³S–0.75% and ³⁴S–4.2%. The most probable molecular formula of the compound is: (A) C₇H₂₁N₂O (B) C₅H₁₁NO₂S (C) C₆H₁₃O₂S (D) C₆H₁₅NOS

Determining Molecular Formula

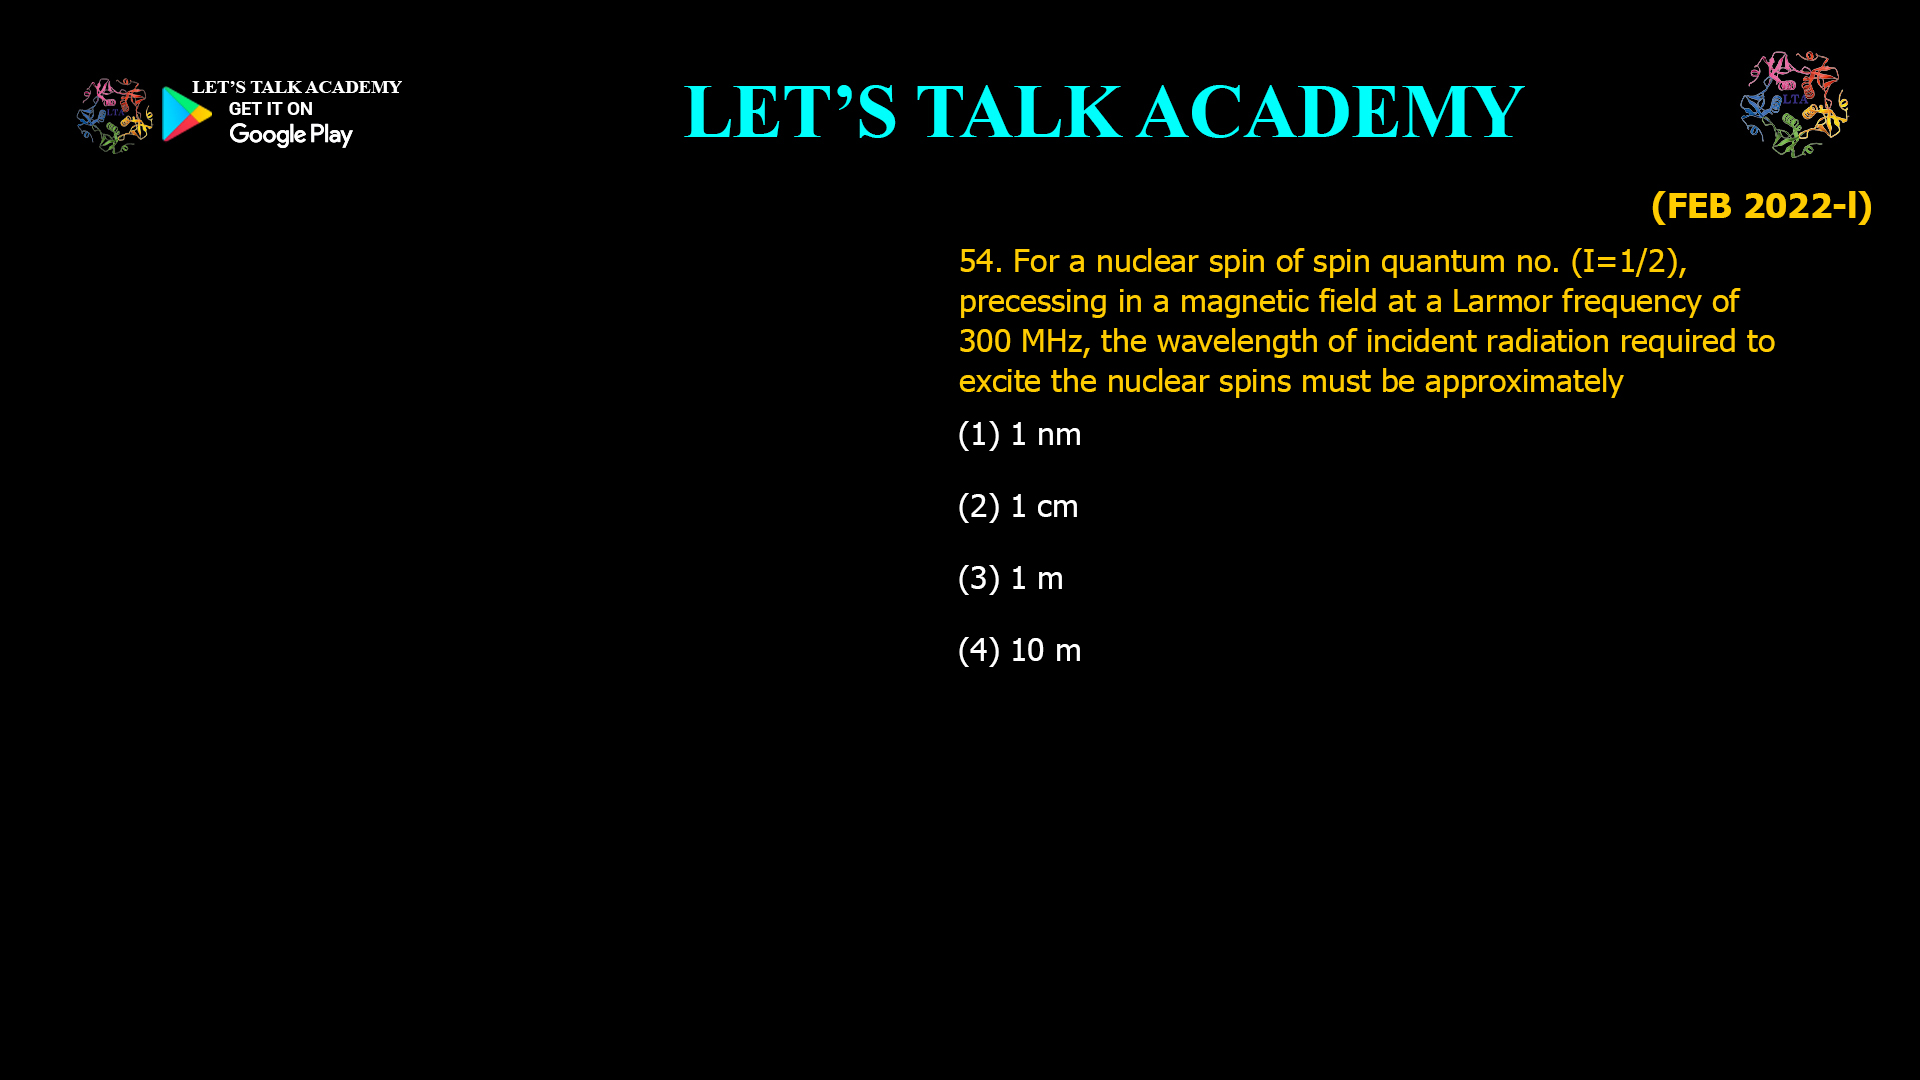
54. For a nuclear spin of spin quantum number (I = 1/2), precessing in a magnetic field at a Larmor frequency of 300 MHz, the wavelength of incident radiation required to excite the nuclear spins must be approximately (A) 1 nm (B) 1 cm (C) 1 m (D) 10 m

Calculating the Wavelength of Radiation Required

53. Which one of the following correctly describes the spectroscopic experiment that would help distinguish between an α-helix, 3₁₀ helix and π helix? (A) Near UV absorption spectrum between 250–300 nm. (B) Fluorescence emission spectra between 350–400 nm. (C) ¹H NMR spectroscopy involving Hydrogen/Deuterium exchange. (D) Near UV Circular Dichroism spectrum between 250–300 nm.

Distinguishing α-Helix, 3₁₀ Helix, and π-Helix

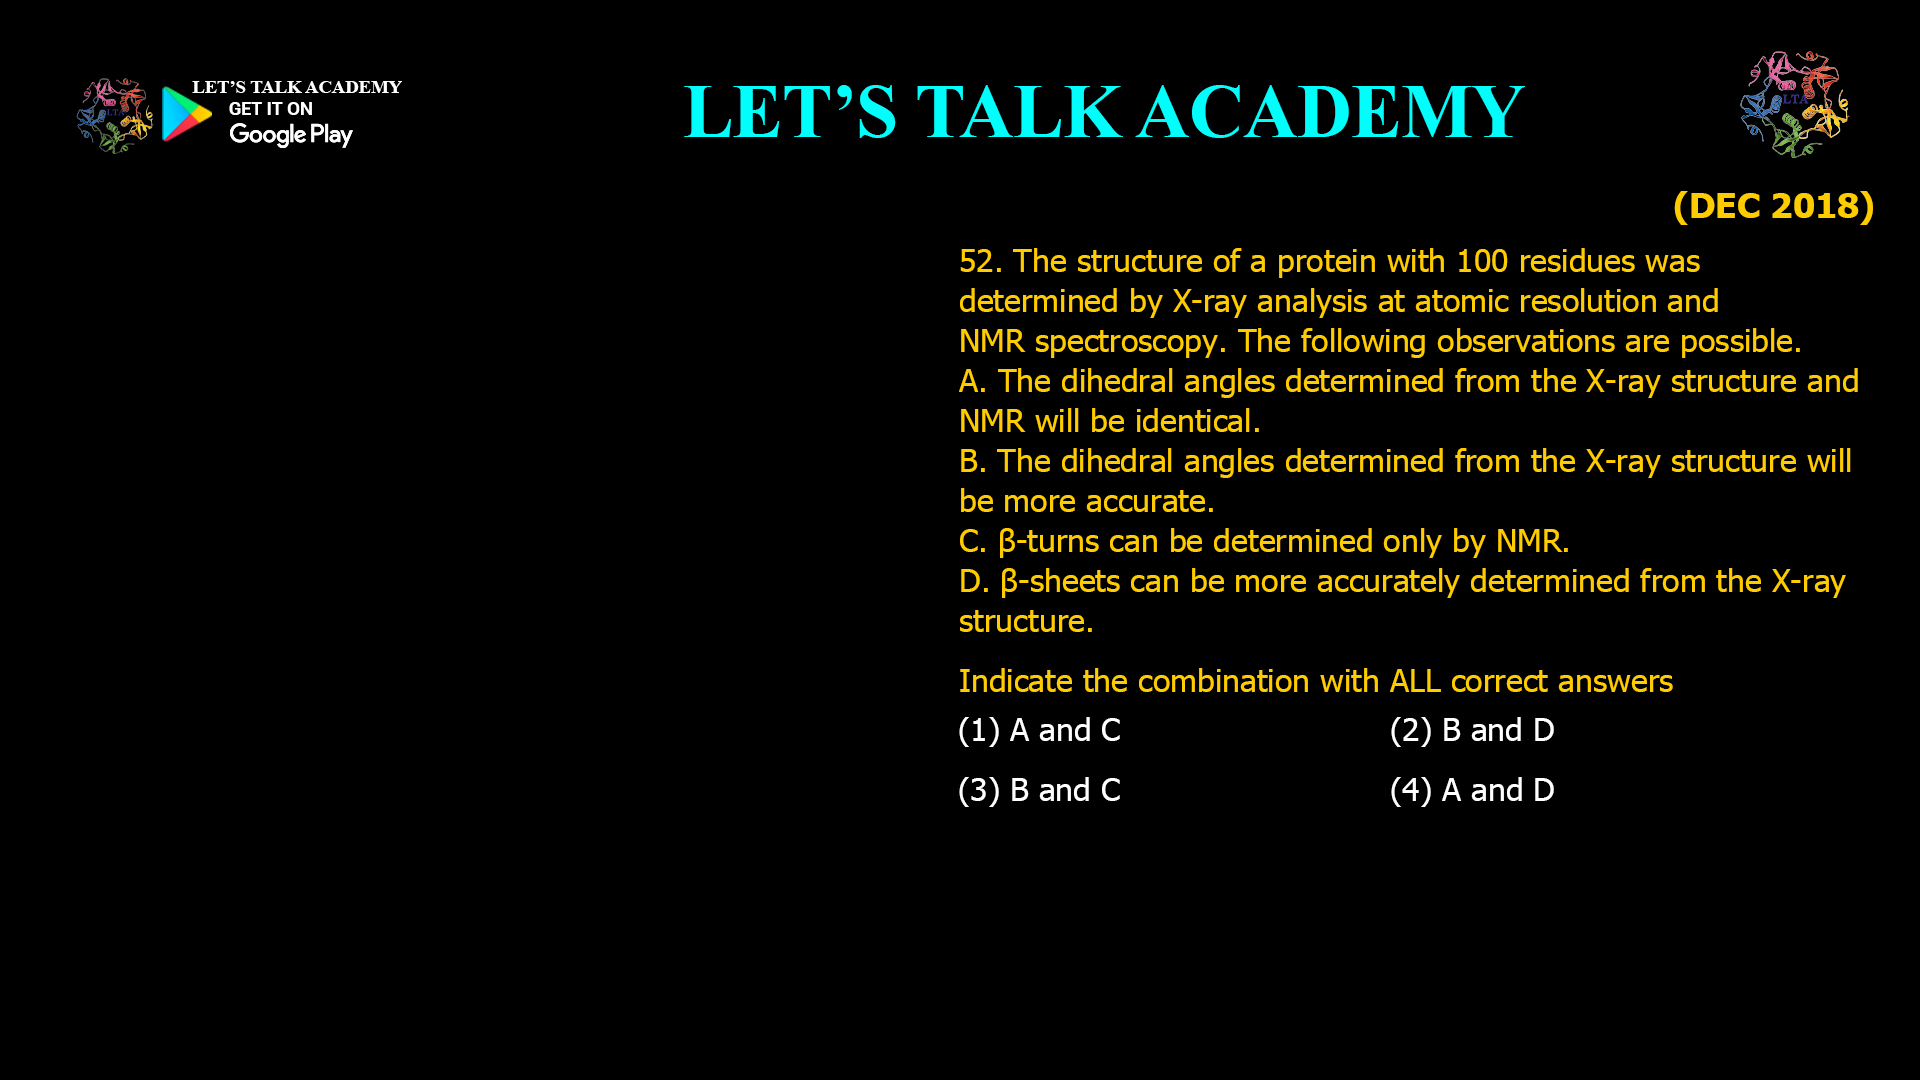
52. The structure of a protein with 100 residues was determined by X-ray analysis at atomic resolution and NMR spectroscopy. The following observations are possible. A. The dihedral angles determined from the X-ray structure and NMR will be identical. B. The dihedral angles determined from the X-ray structure will be more accurate. C. β-turns can be determined only by NMR. D. β-sheets can be more accurately determined from the X-ray structure. Indicate the combination with ALL correct answers. (A) A and C (B) B and D (C) B and C (D) A and D

Comparison of X-ray Crystallography and NMR Spectroscopy

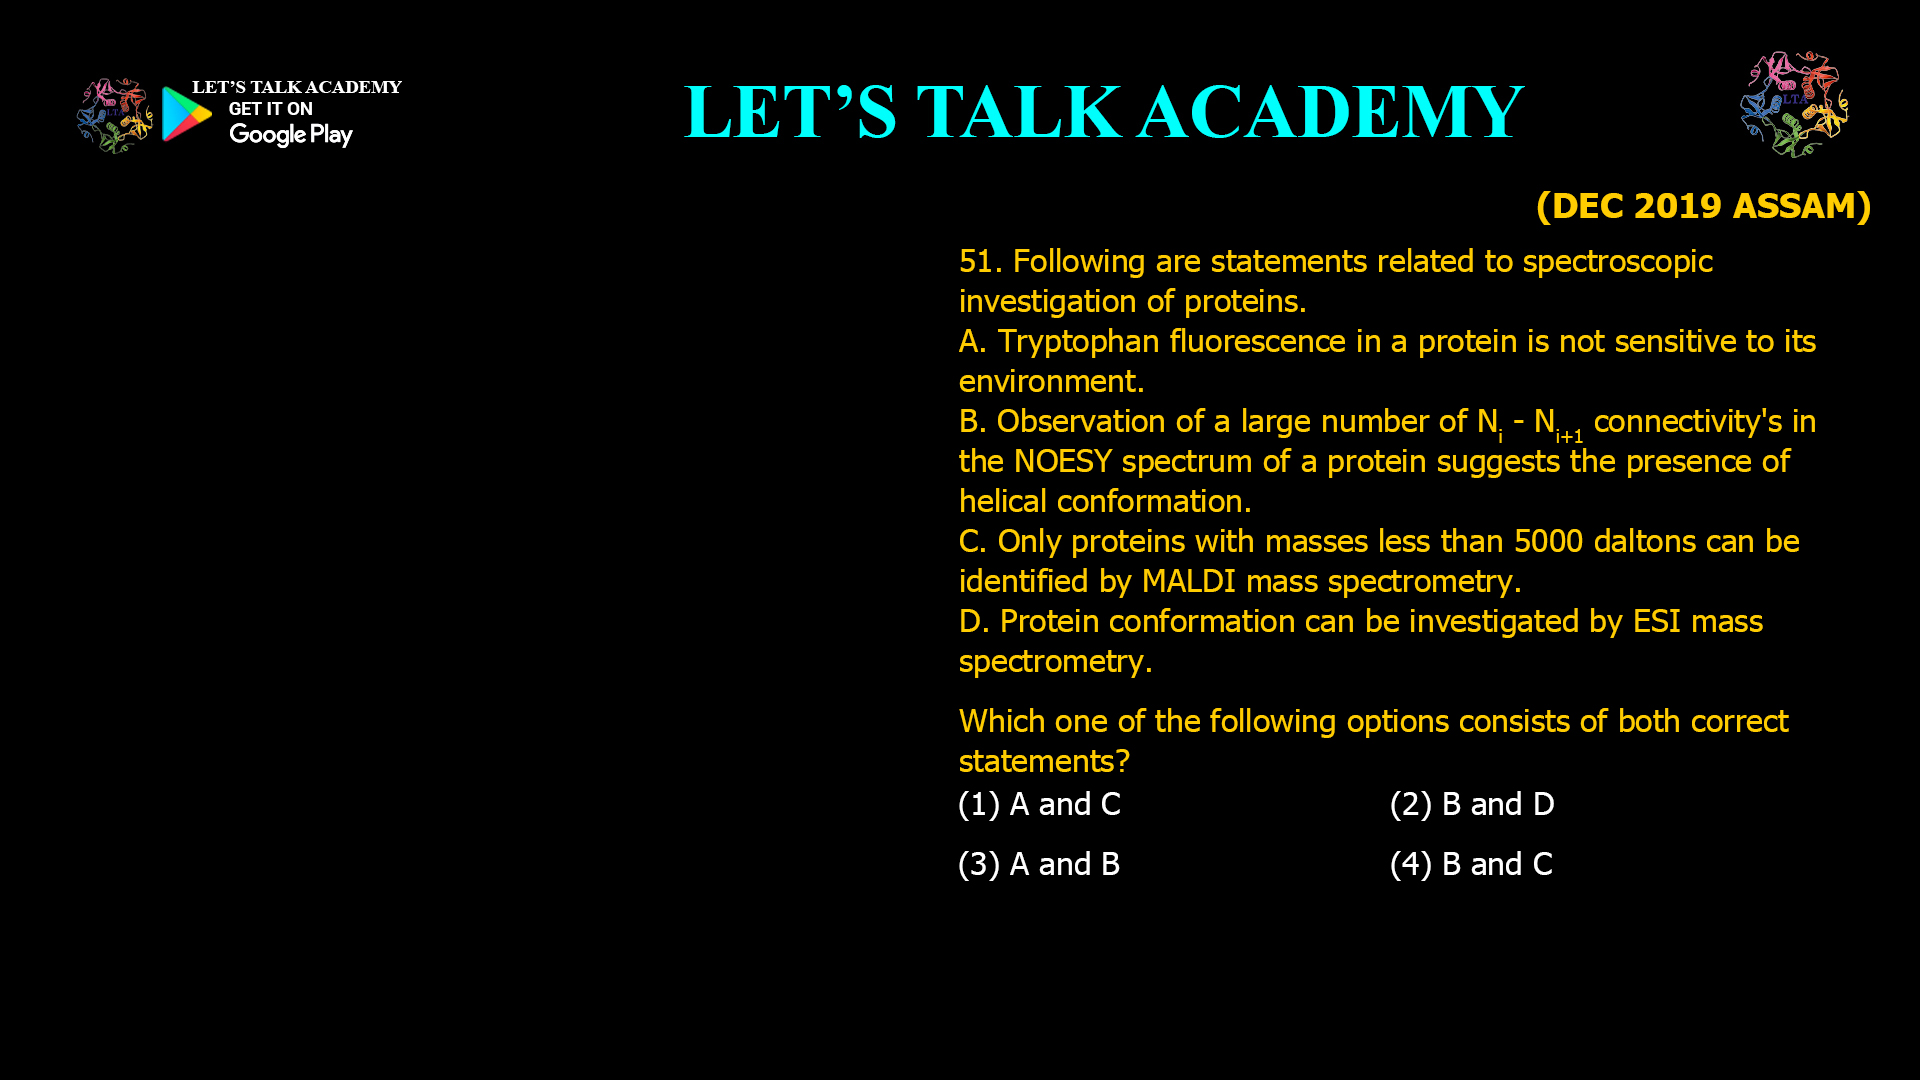
51. Following are statements related to spectroscopic investigation of proteins. A. Tryptophan fluorescence in a protein is not sensitive to its environment. B. Observation of a large number of Nᵢ − Nᵢ₊₁ connectivities in the NOESY spectrum of a protein suggests the presence of helical conformation. C. Only proteins with masses less than 5000 daltons can be identified by MALDI mass spectrometry. D. Protein conformation can be investigated by ESI mass spectrometry. Which one of the following options consists of both correct statements? (A) A and C (B) B and D (C) A and B (D) B and C

Spectroscopic Investigation of Proteins

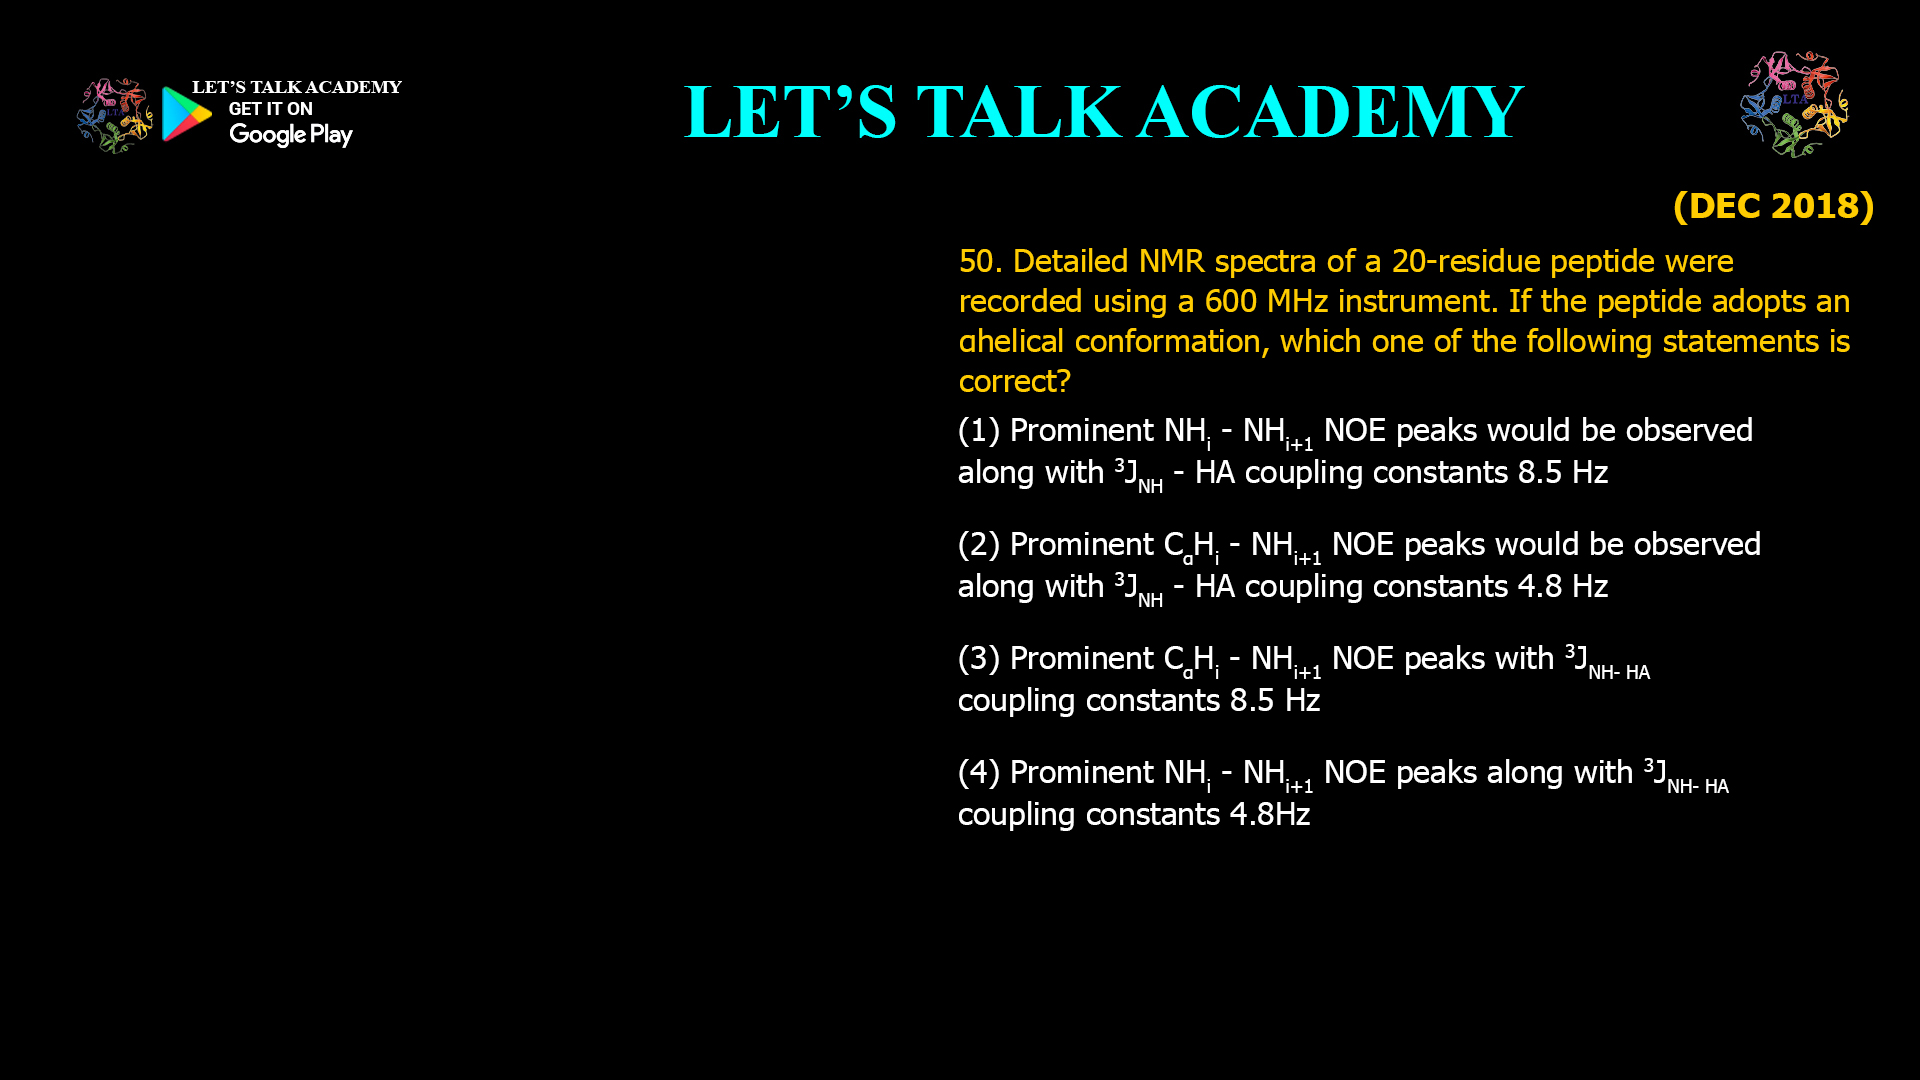
50. Detailed NMR spectra of a 20-residue peptide were recorded using a 600 MHz instrument. If the peptide adopts an α-helical conformation, which one of the following statements is correct? (A) Prominent NHᵢ − NHᵢ₊₁ NOE peaks would be observed along with ³JNH–Hα coupling constants 8.5 Hz. (B) Prominent CαHᵢ − NHᵢ₊₁ NOE peaks would be observed along with ³JNH–Hα coupling constants 4.8 Hz. (C) Prominent CαHᵢ − NHᵢ₊₁ NOE peaks with ³JNH–Hα coupling constants 8.5 Hz. (D) Prominent NHᵢ − NHᵢ₊₁ NOE peaks along with ³JNH–Hα coupling constants 4.8 Hz.

Identifying Alpha-Helical Peptides Using NOE Patterns

49. The conformation of a 30-residue peptide is studied by NMR spectroscopy. The JNH for most of the amide protons is 4 Hz. The 2D NOESY spectrum shows prominent Nᵢ–Nᵢ₊₁ connectivities. The conformation of the peptide is (A) Anti-parallel β sheet. (B) Parallel β sheet. (C) Helix-like. (D) Unordered.

Identifying Helical Peptide Conformation

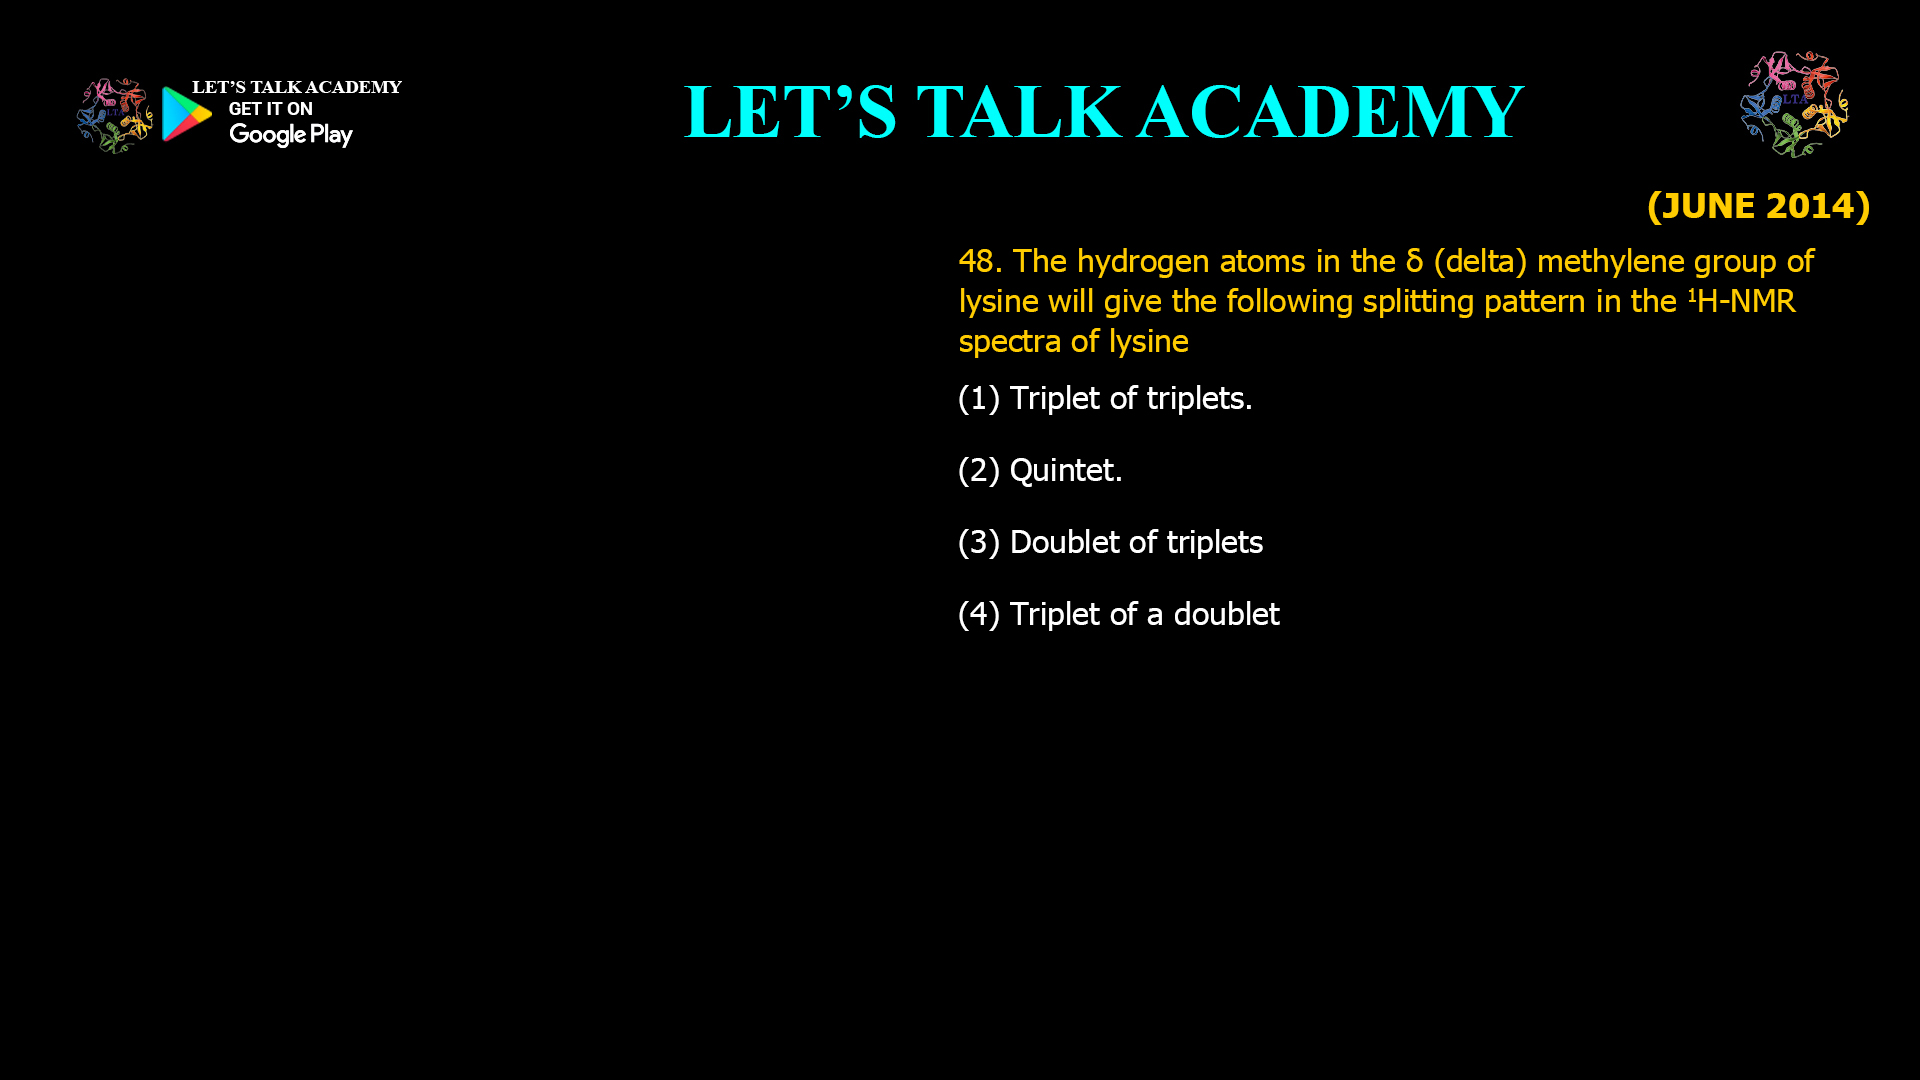
48. The hydrogen atoms in the δ (delta) methylene group of lysine will give the following splitting pattern in the ¹H-NMR spectra of lysine (A) Triplet of triplets. (B) Quintet. (C) Doublet of triplets. (D) Triplet of a doublet.

Splitting Pattern of the δ-Methylene Protons

47. The Nuclear Magnetic Resonance (1D and 2D) spectrum of a 30-residue peptide were recorded at 25°C. The following observations were made. A. The NH and CαH resonances were well resolved. B. The NOESY spectra showed extensive Nᵢ − Nᵢ₊₁ connectivities. C. The NH resonances showed slow exchange with deuterium. The spectra indicates that the peptide adopts (A) Helical conformations (B) Anti-parallel β-strand conformations (C) Polyproline conformation (D) β-turn conformation with four amino acids participating in the turn. Rest of the amino acids are unstructured.

Interpreting 1D and 2D NMR Spectra

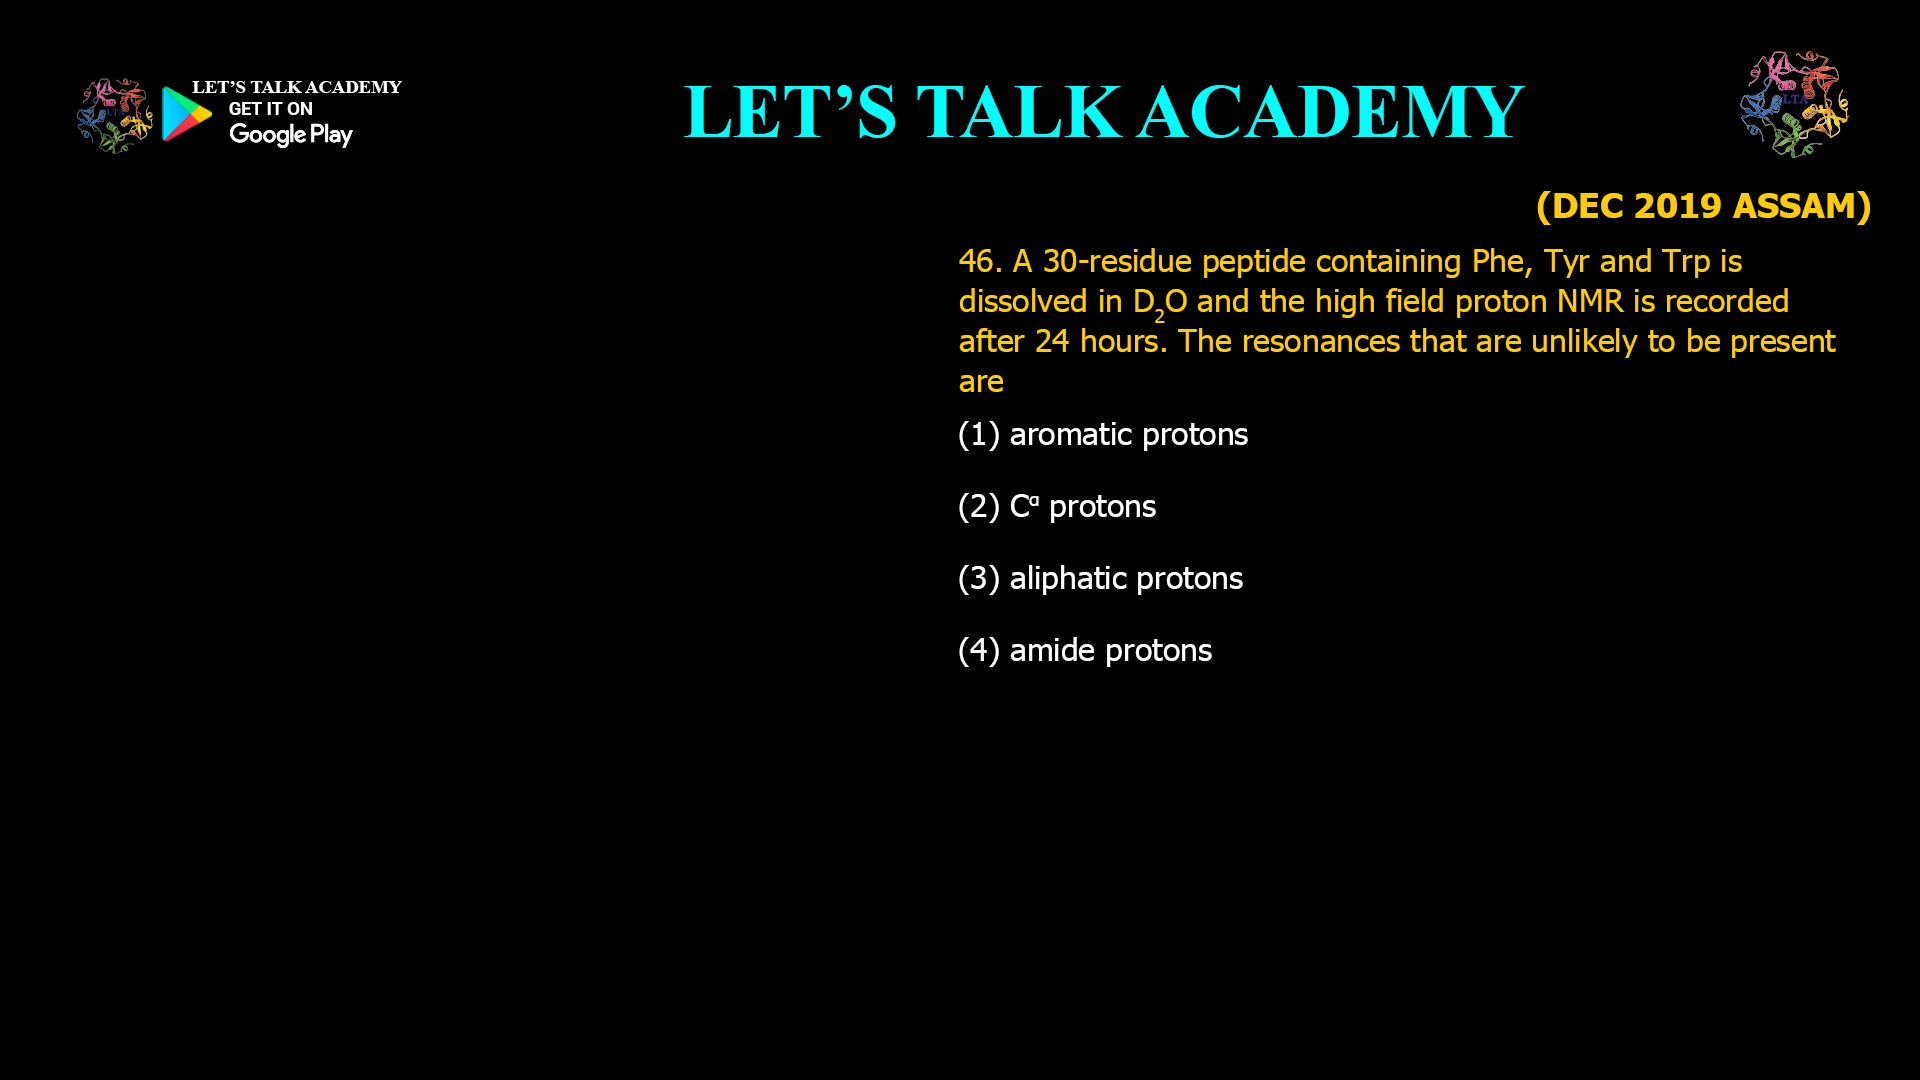
46. A 30-residue peptide containing Phe, Tyr and Trp is dissolved in D₂O and the high field proton NMR is recorded after 24 hours. The resonances that are unlikely to be present are (A) Aromatic protons (B) Cα protons (C) Aliphatic protons (D) Amide protons

Effect of D₂O on Proton NMR of Peptides

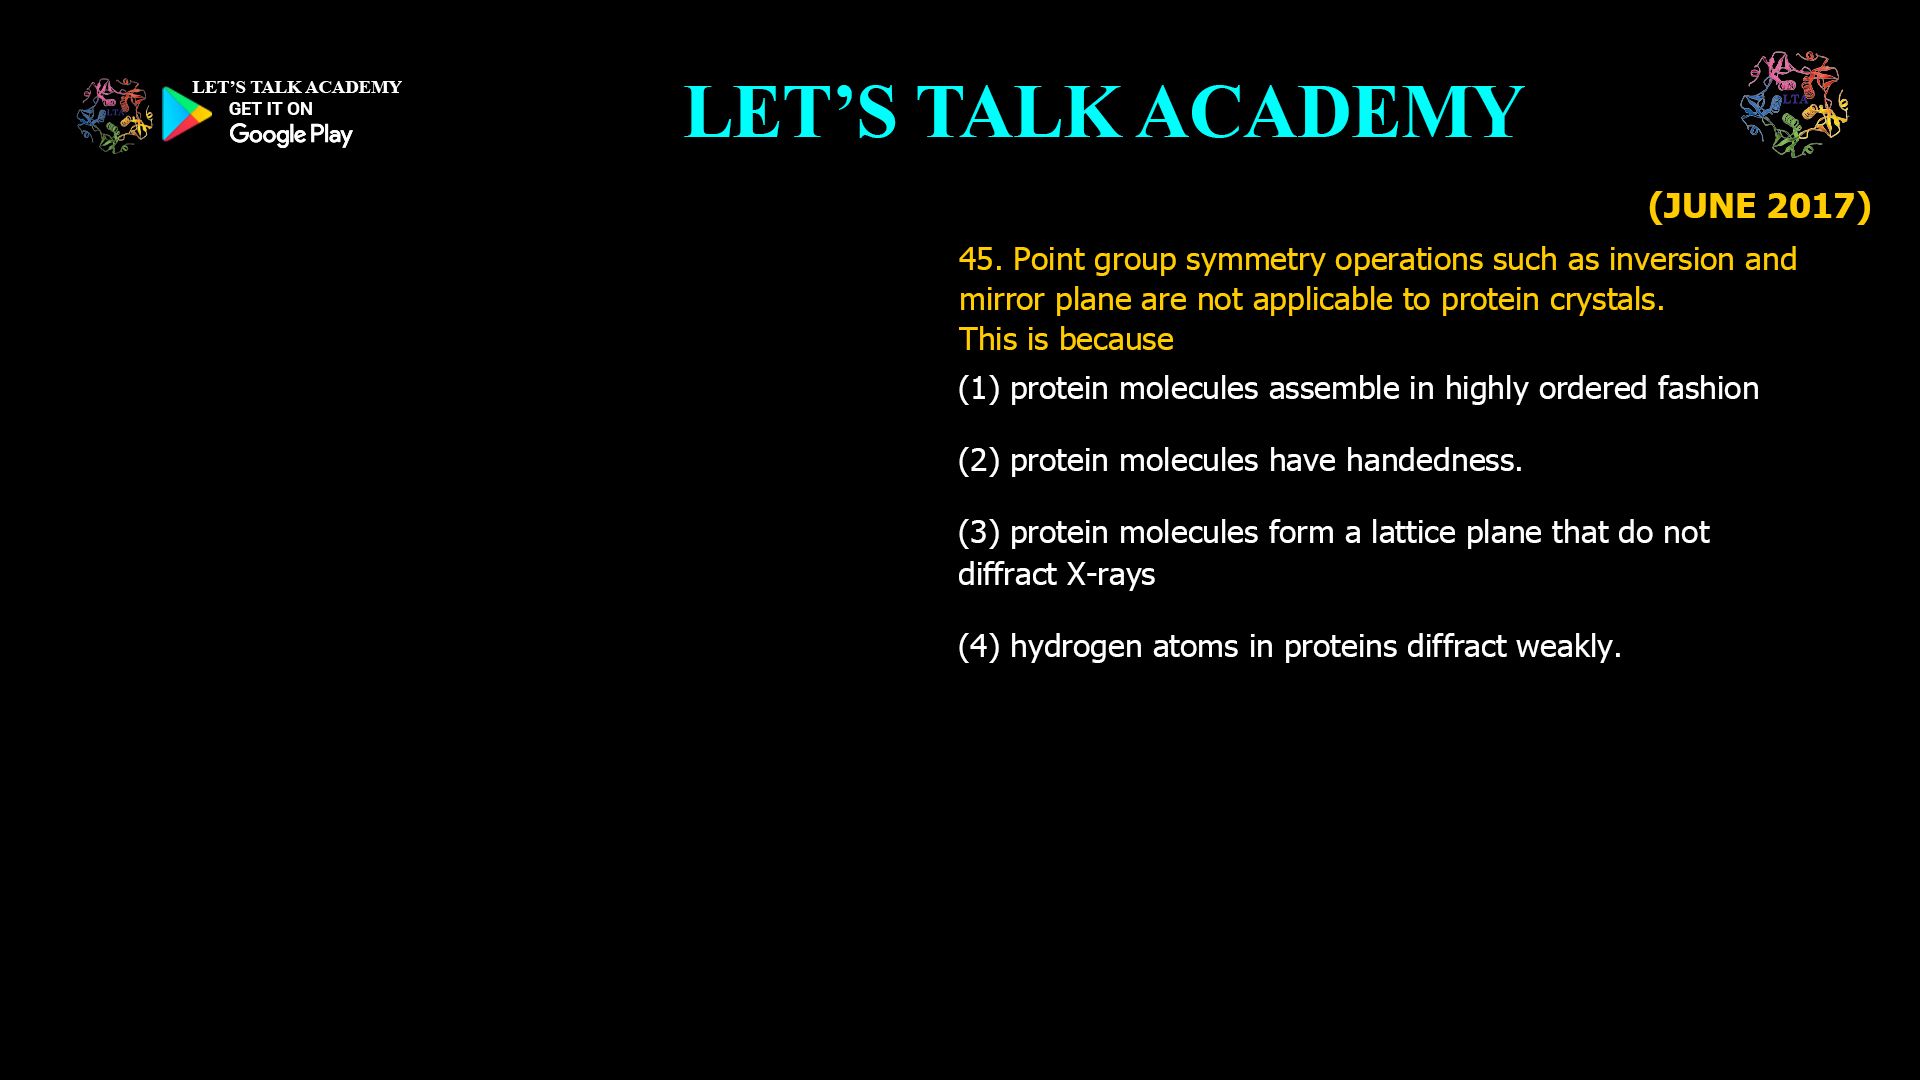
45. Point group symmetry operations such as inversion and mirror plane are not applicable to protein crystals. This is because (A) Protein molecules assemble in highly ordered fashion. (B) Protein molecules have handedness. (C) Protein molecules form a lattice plane that do not diffract X-rays. (D) Hydrogen atoms in proteins diffract weakly.

Why Mirror Plane and Inversion Symmetry

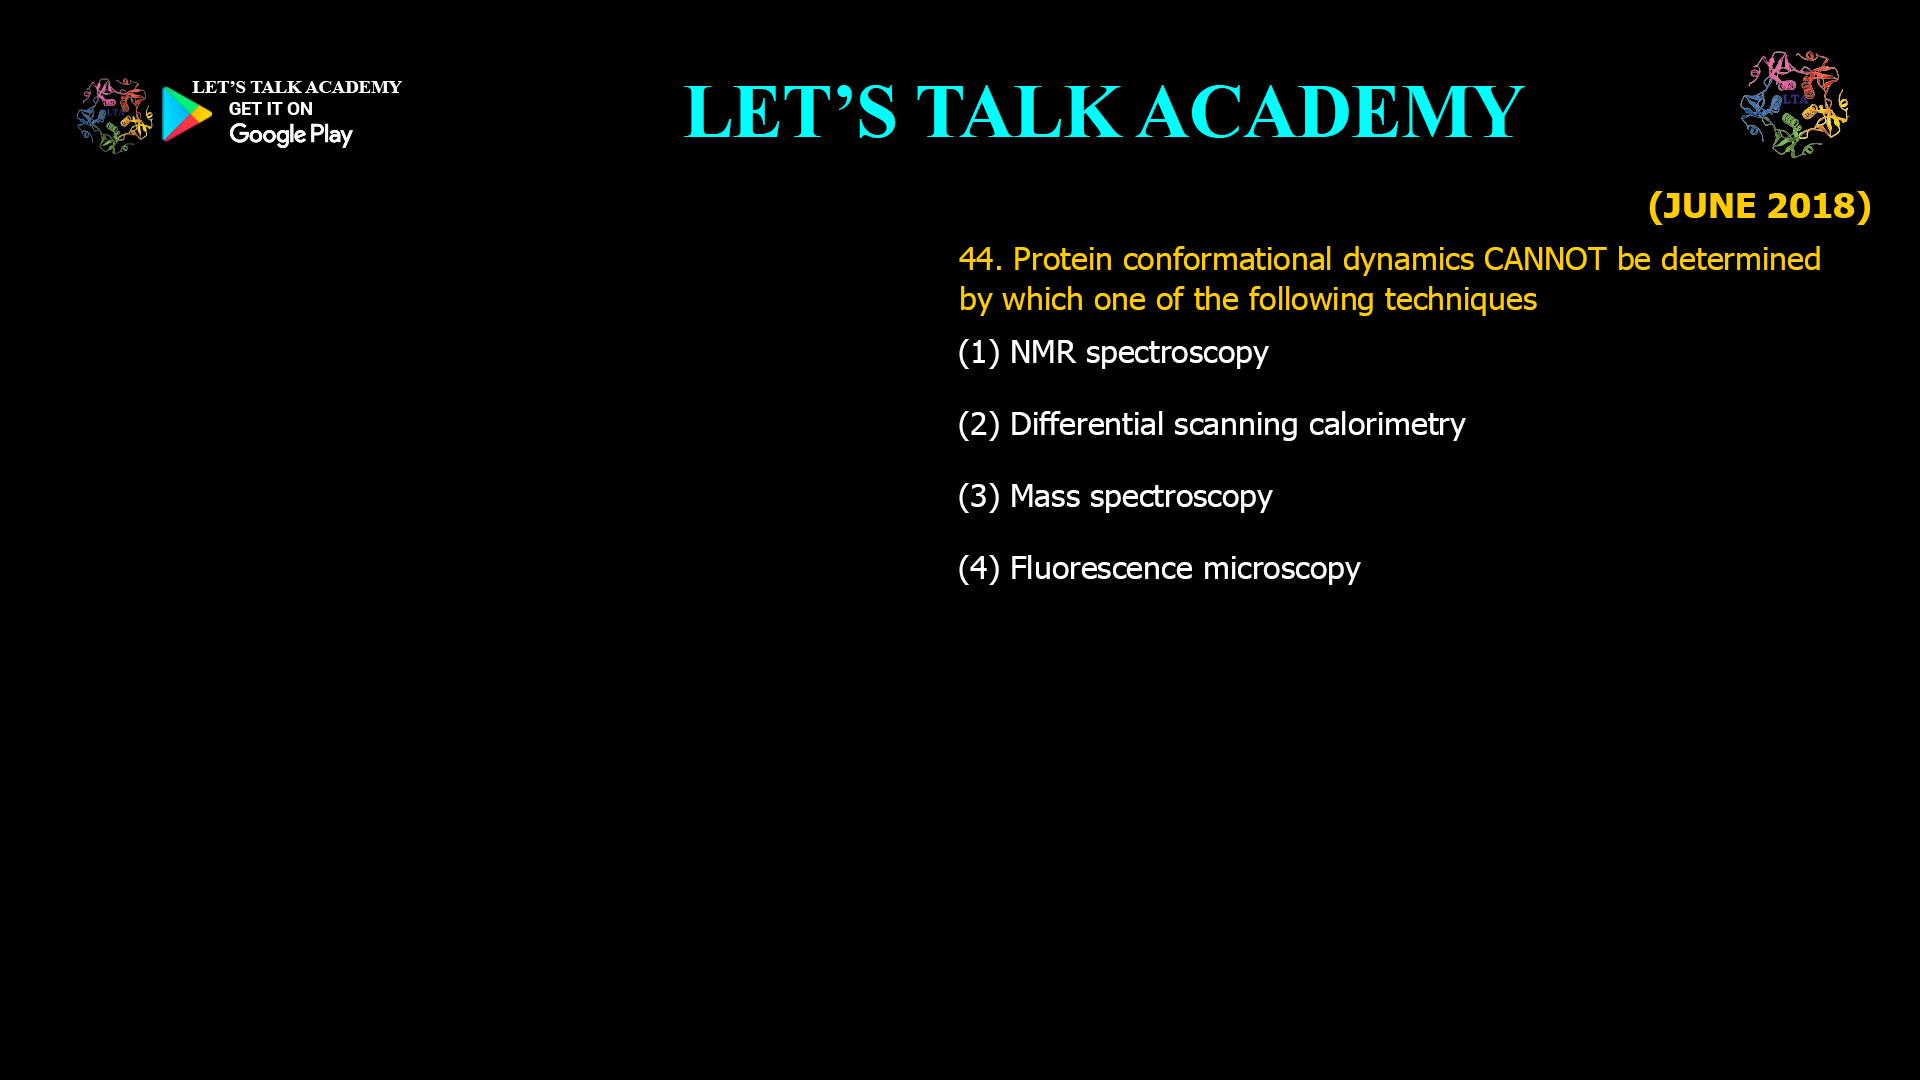
44. Protein conformational dynamics CANNOT be determined by which one of the following techniques? (A) NMR spectroscopy (B) Differential scanning calorimetry (C) Mass spectroscopy (D) Fluorescence microscopy

Protein Conformational Dynamics

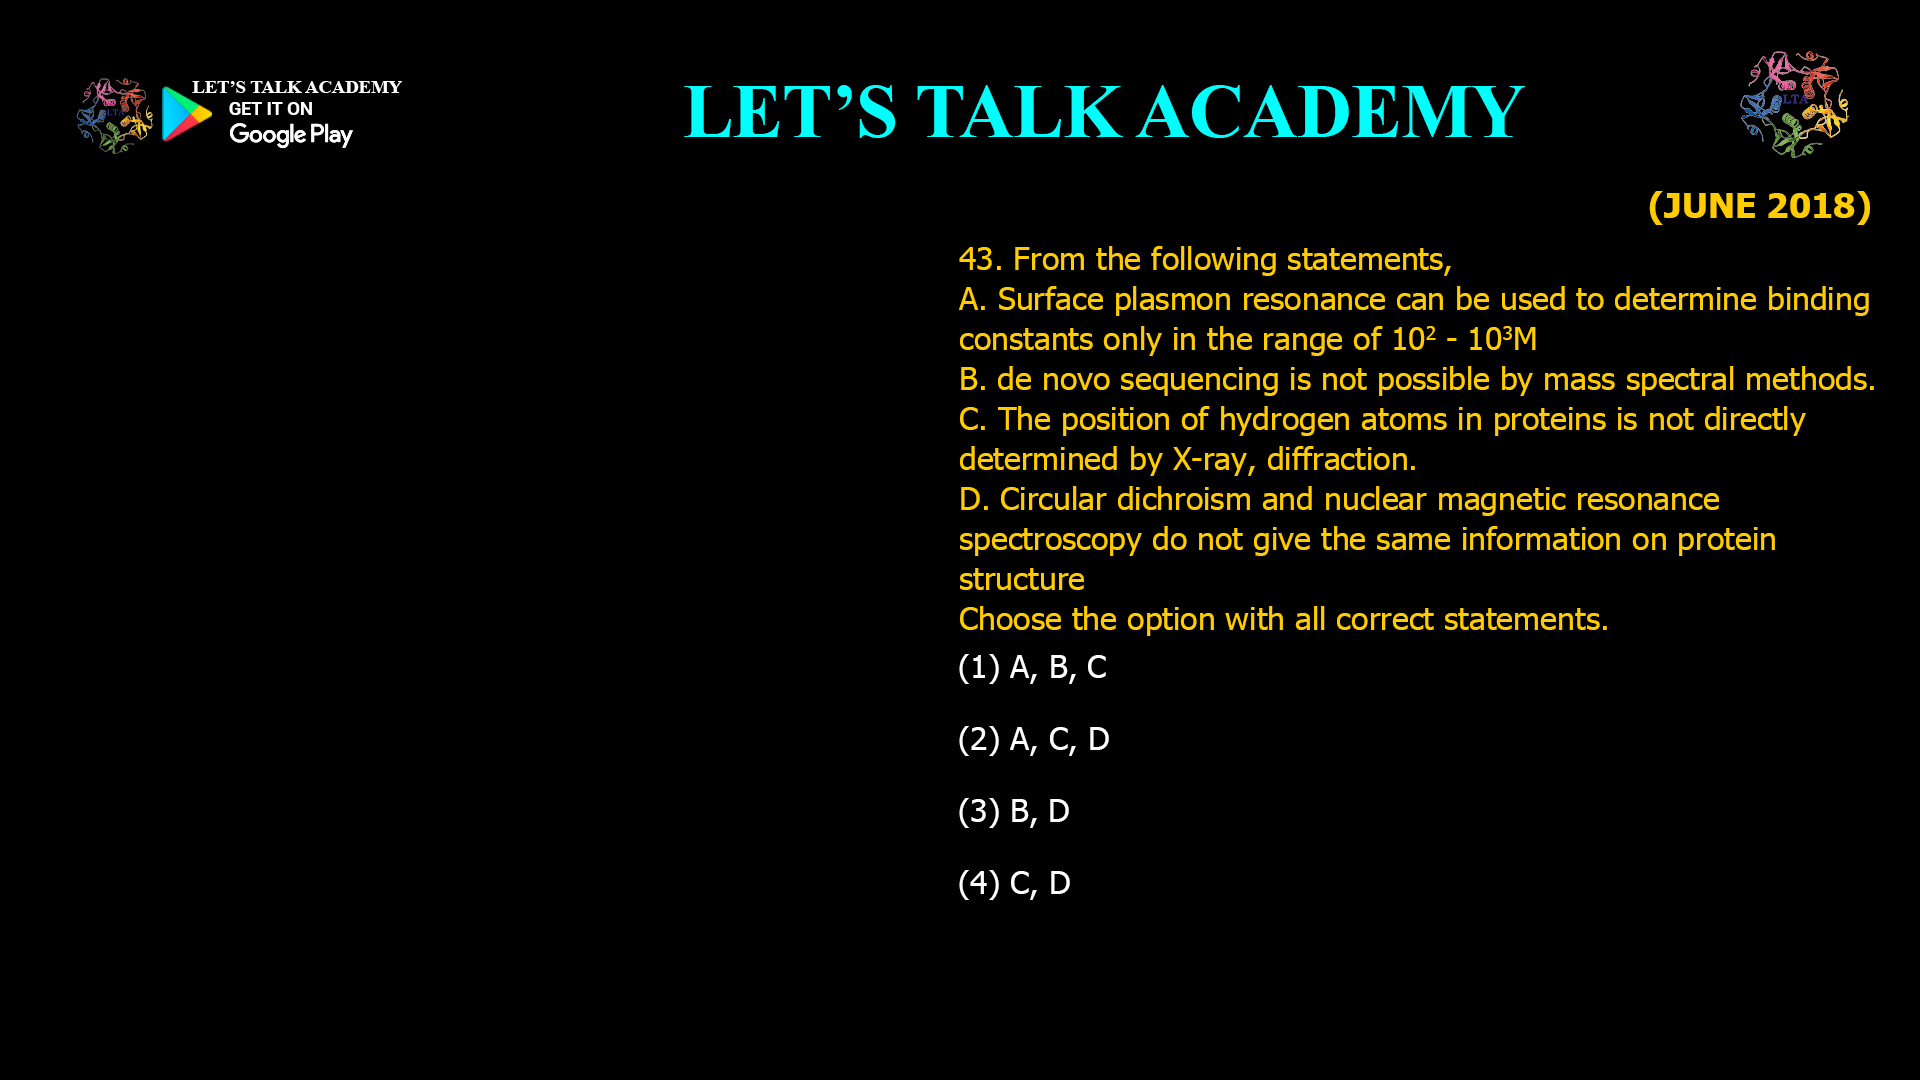
43. From the following statements, A. Surface plasmon resonance can be used to determine binding constants only in the range of 10²–10³ M. B. De novo sequencing is not possible by mass spectral methods. C. The position of hydrogen atoms in proteins is not directly determined by X-ray diffraction. D. Circular dichroism and nuclear magnetic resonance spectroscopy do not give the same information on protein structure. Choose the option with all correct statements. (A) A, B, C (B) A, C, D (C) B, D (D) C, D

Protein Structure Analysis Techniques

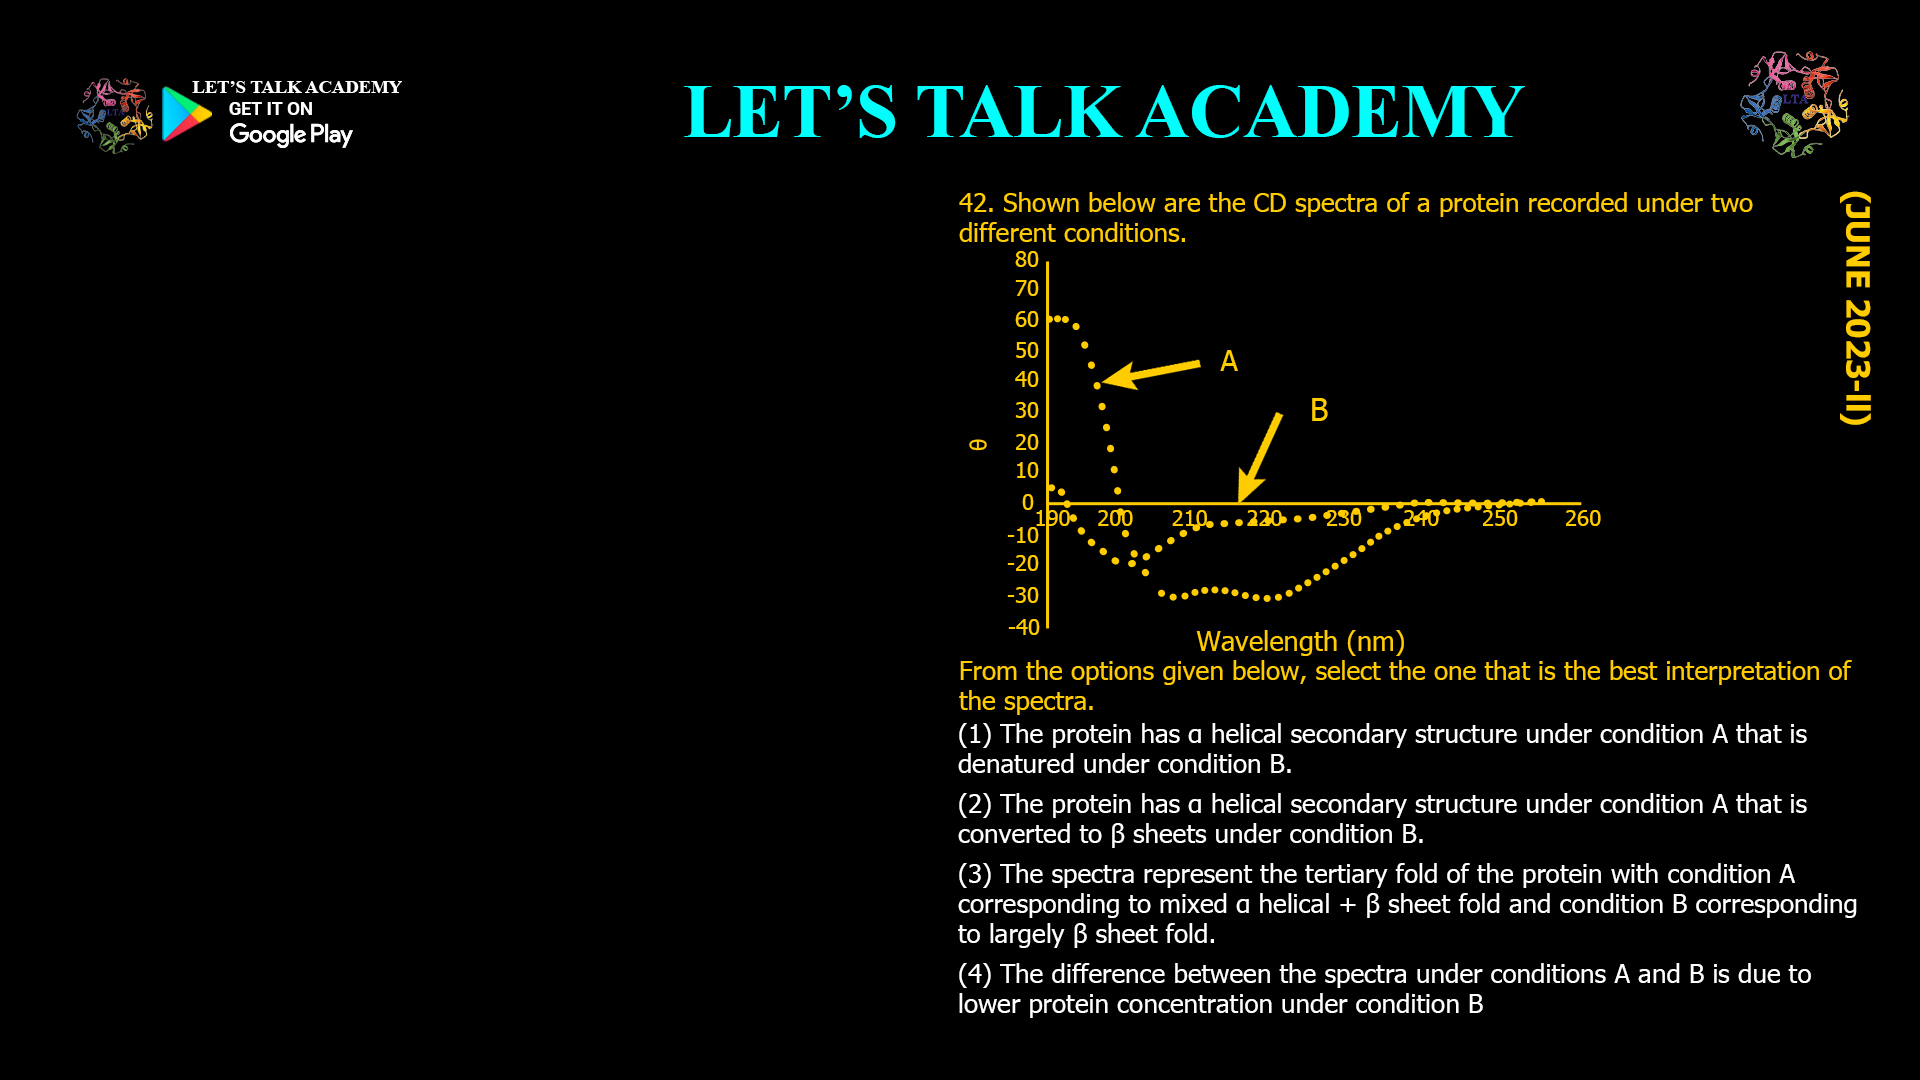
42. Shown below are the CD spectra of a protein recorded under two different conditions. From the options given below, select the one that is the best interpretation of the spectra. (A) The protein has a helical secondary structure under condition A that is denatured under condition B. (B) The protein has a helical secondary structure under condition A that is converted to β sheets under condition B. (C) The spectra represent the tertiary fold of the protein with condition A corresponding to mixed α helix + β sheet fold and condition B corresponding to largely β sheet fold. (D) The difference between the spectra under conditions A and B is due to lower protein concentration under condition B.

Interpreting Far-UV Circular Dichroism Spectra

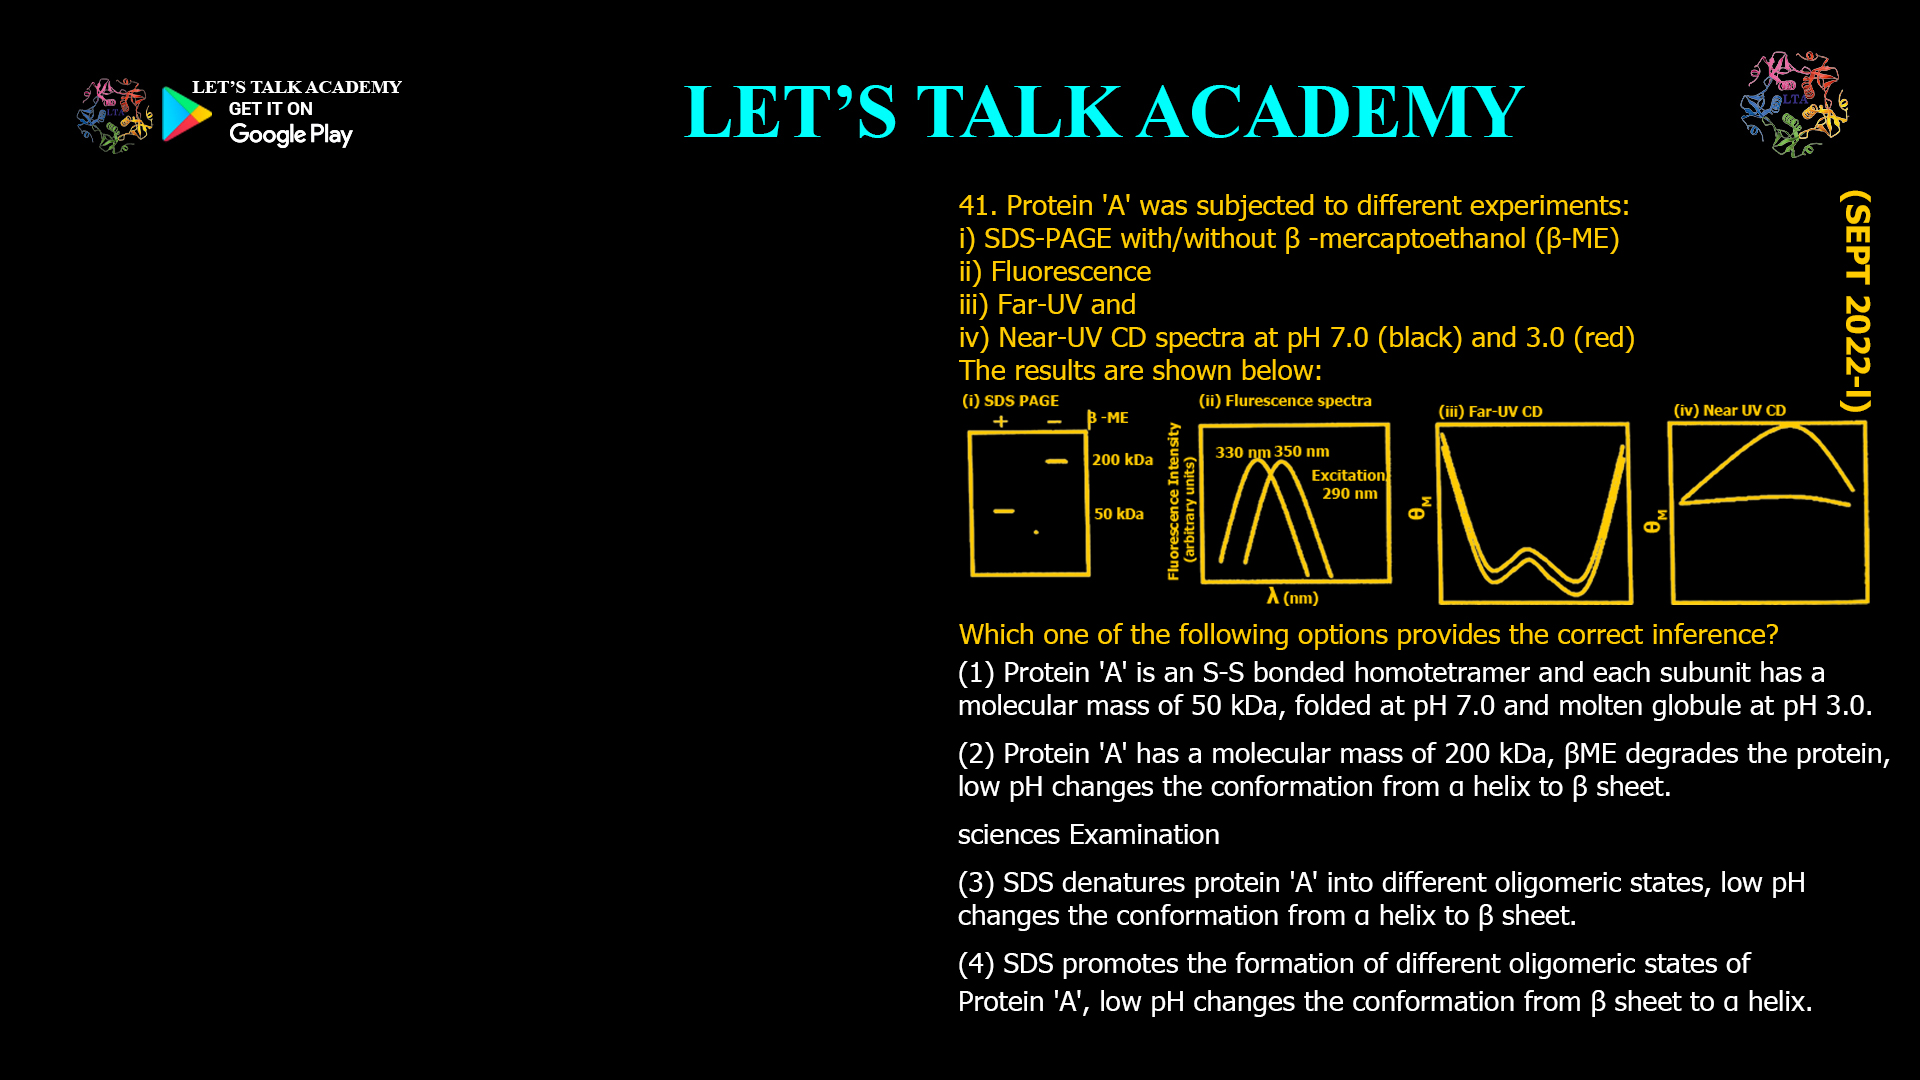
41. Protein 'A' was subjected to different experiments: (i) SDS-PAGE with/without β-mercaptoethanol (β-ME) (ii) Fluorescence (iii) Far-UV CD (iv) Near-UV CD spectra at pH 7.0 (black) and 3.0 (red) The results are shown below. Which one of the following options provides the correct inference? (A) Protein 'A' is an S-S bonded homotetramer and each subunit has a molecular mass of 50 kDa, folded at pH 7.0 and molten globule at pH 3.0. (B) Protein 'A' has a molecular mass of 200 kDa, β-ME degrades the protein, low pH changes the conformation from α-helix to β-sheet. (C) SDS denatures protein 'A' into different oligomeric states, low pH changes the conformation from α-helix to β-sheet. (D) SDS promotes the formation of different oligomeric states of Protein 'A', low pH changes the conformation from β-sheet to α-helix.

Interpreting SDS-PAGE, Fluorescence

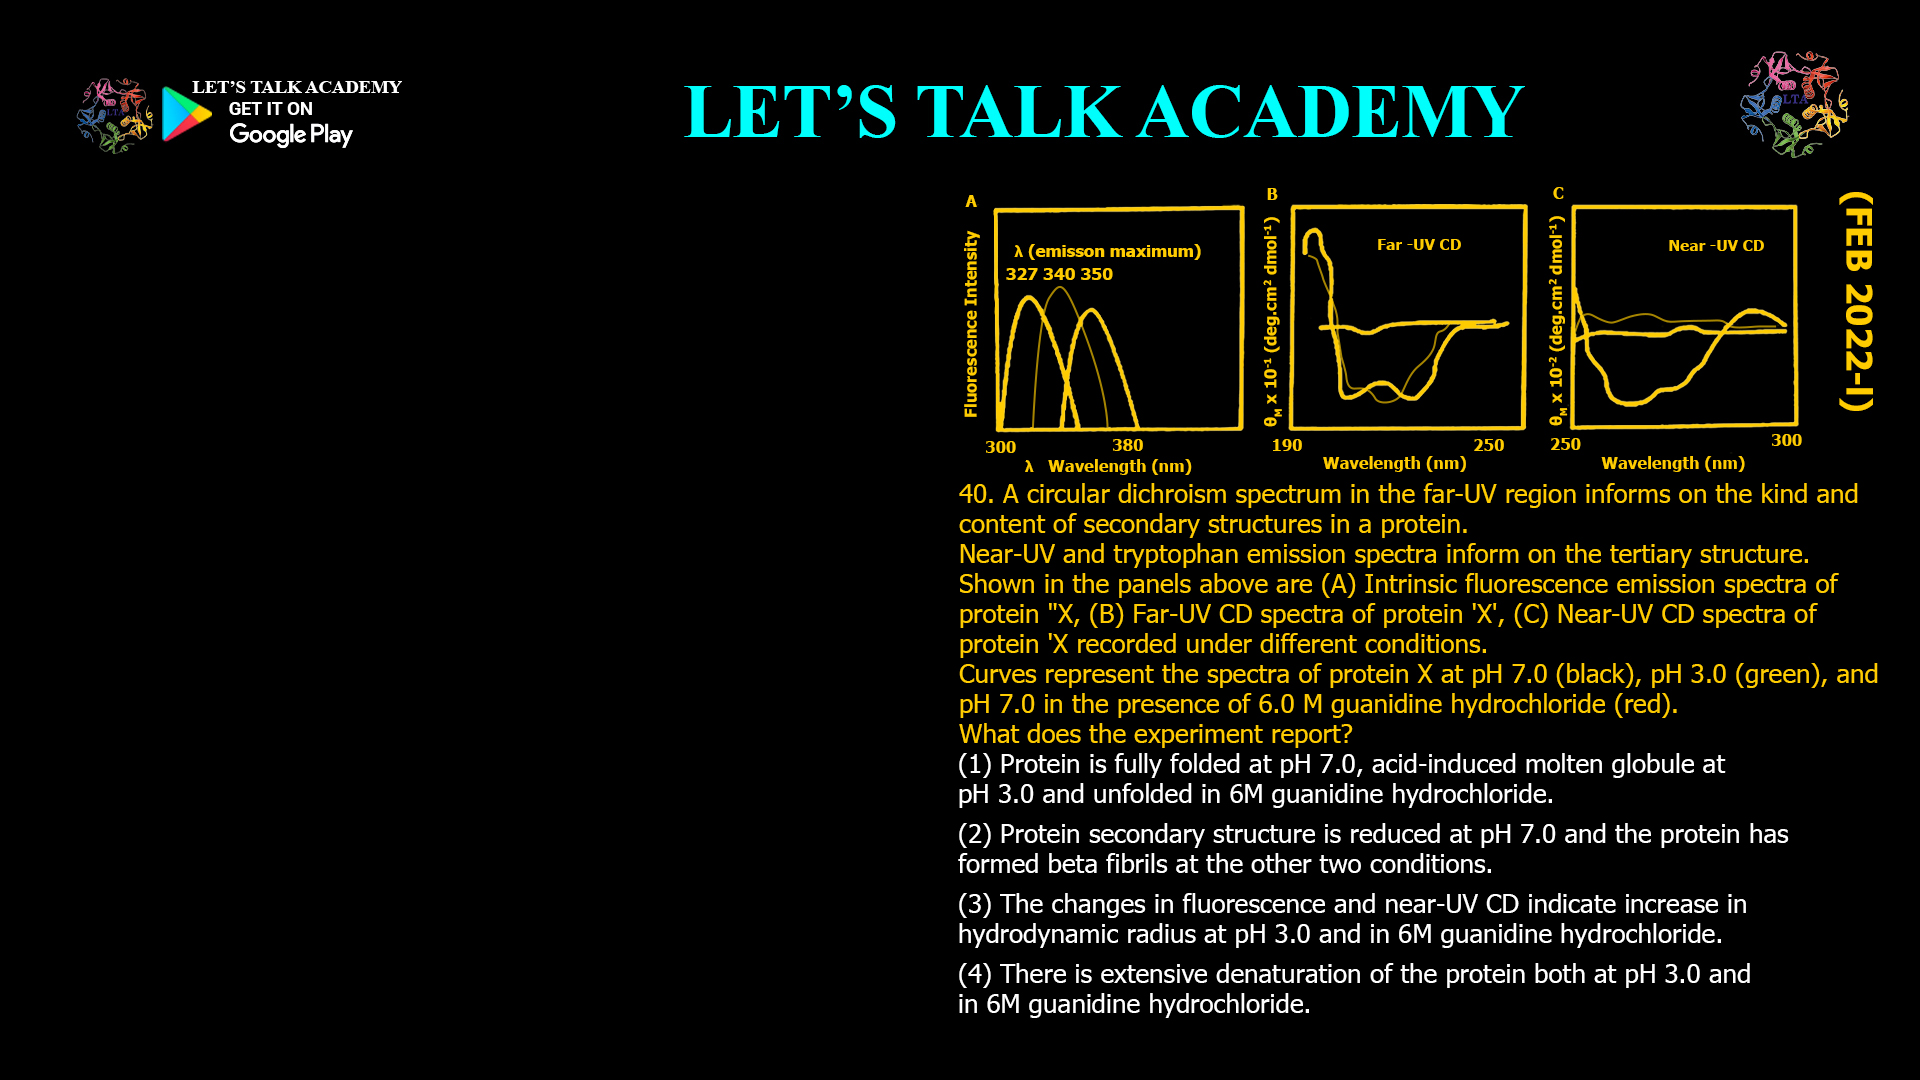
40. A circular dichroism spectrum in the far-UV region informs on the kind and content of secondary structures in a protein. Near-UV and tryptophan emission spectra inform on the tertiary structure. Shown in the panels above are (A) intrinsic fluorescence emission spectra of protein 'X', (B) far-UV CD spectra of protein 'X', (C) near-UV CD spectra of protein 'X' recorded under different conditions. Curves represent the spectra of protein X at pH 7.0 (black), pH 3.0 (green), and pH 7.0 in the presence of 6.0 M guanidine hydrochloride (red). What does the experiment report? (A) Protein is fully folded at pH 7.0, acid-induced molten globule at pH 3.0, and unfolded in 6 M guanidine hydrochloride. (B) Protein secondary structure is reduced at pH 7.0 and the protein has formed β-fibrils at the other two conditions. (C) The changes in fluorescence and near-UV CD indicate increase in hydrodynamic radius at pH 3.0 and in 6 M guanidine hydrochloride. (D) There is extensive denaturation of the protein both at pH 3.0 and in 6 M guanidine hydrochloride.

Interpreting Fluorescence, Far-UV CD, and Near-UV CD Spectra

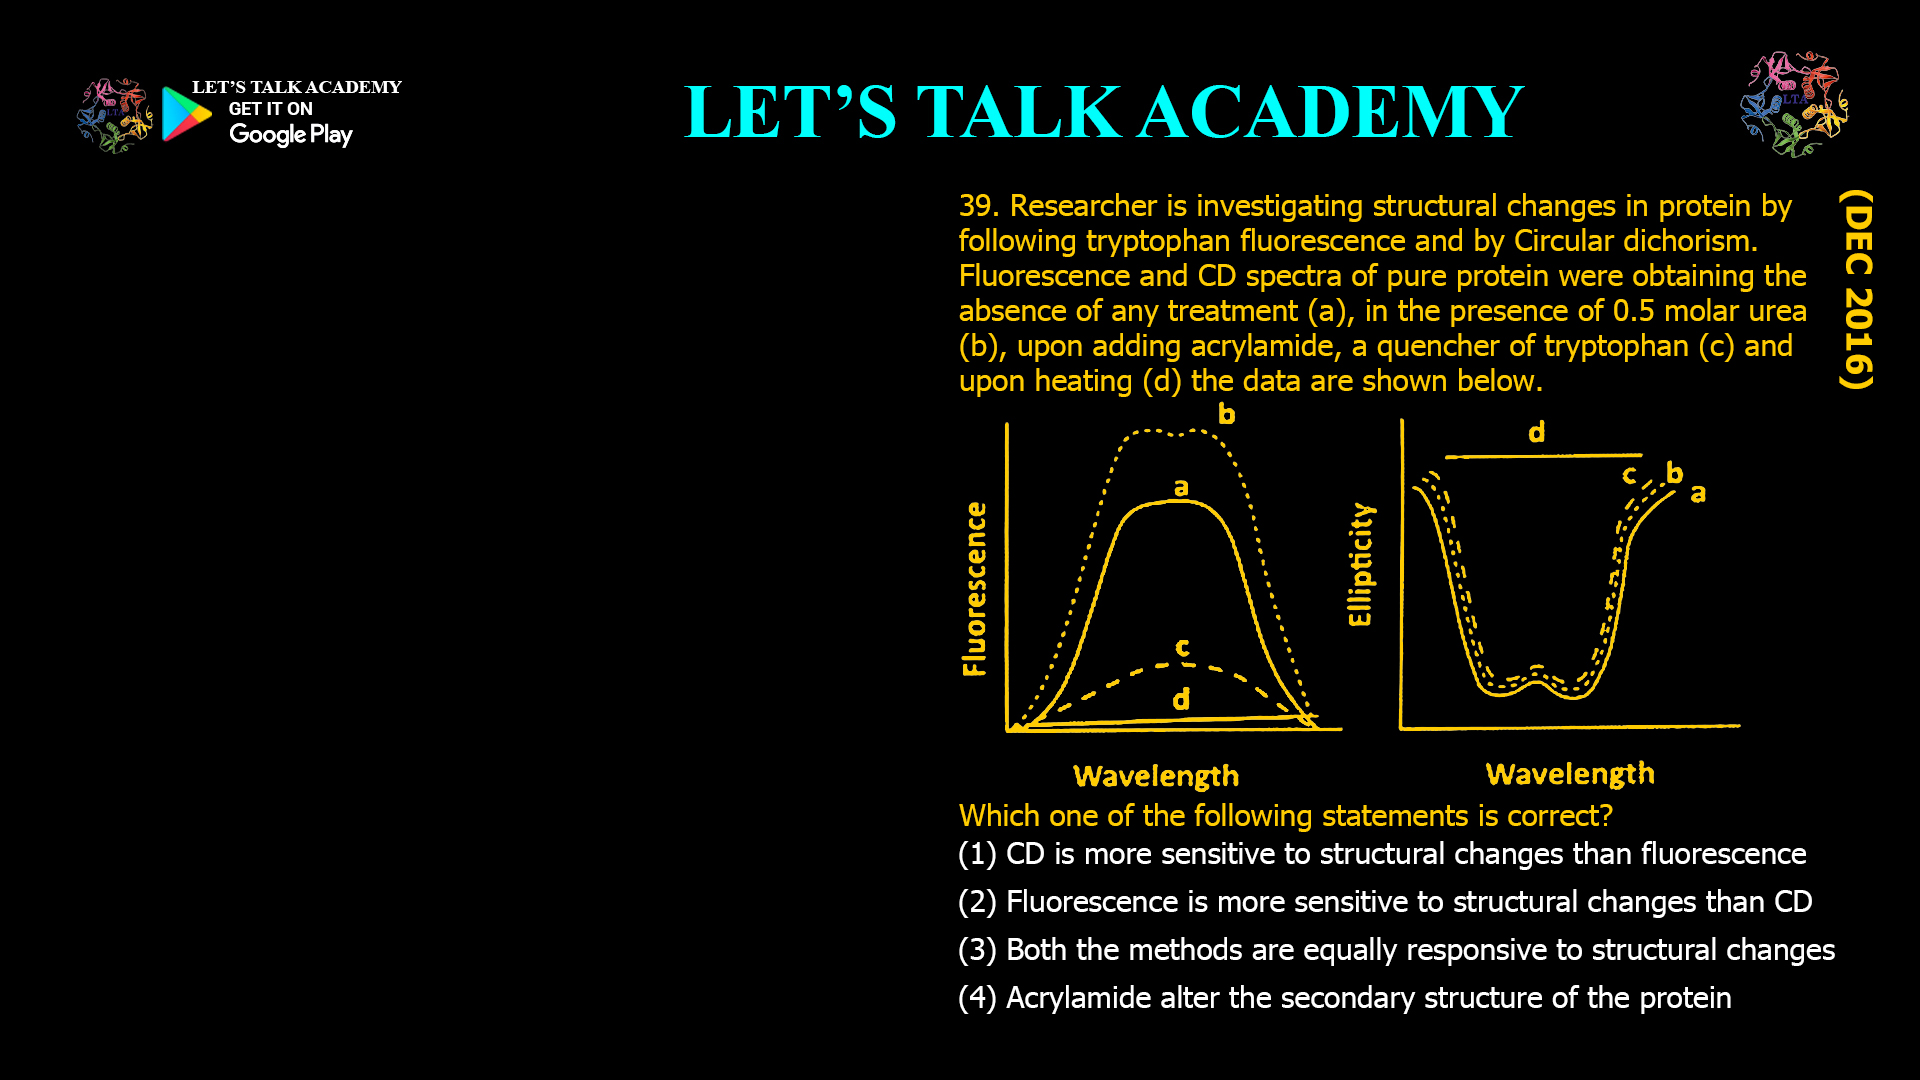
39. A researcher is investigating structural changes in a protein by following tryptophan fluorescence and circular dichroism. Fluorescence and CD spectra of the pure protein were obtained in the absence of any treatment (A), in the presence of 0.5 M urea (B), upon adding acrylamide, a quencher of tryptophan (C), and upon heating (D). The data are shown below. Which one of the following statements is correct? (A) CD is more sensitive to structural changes than fluorescence. (B) Fluorescence is more sensitive to structural changes than CD. (C) Both the methods are equally responsive to structural changes. (D) Acrylamide alters the secondary structure of the protein.

Fluorescence vs Circular Dichroism

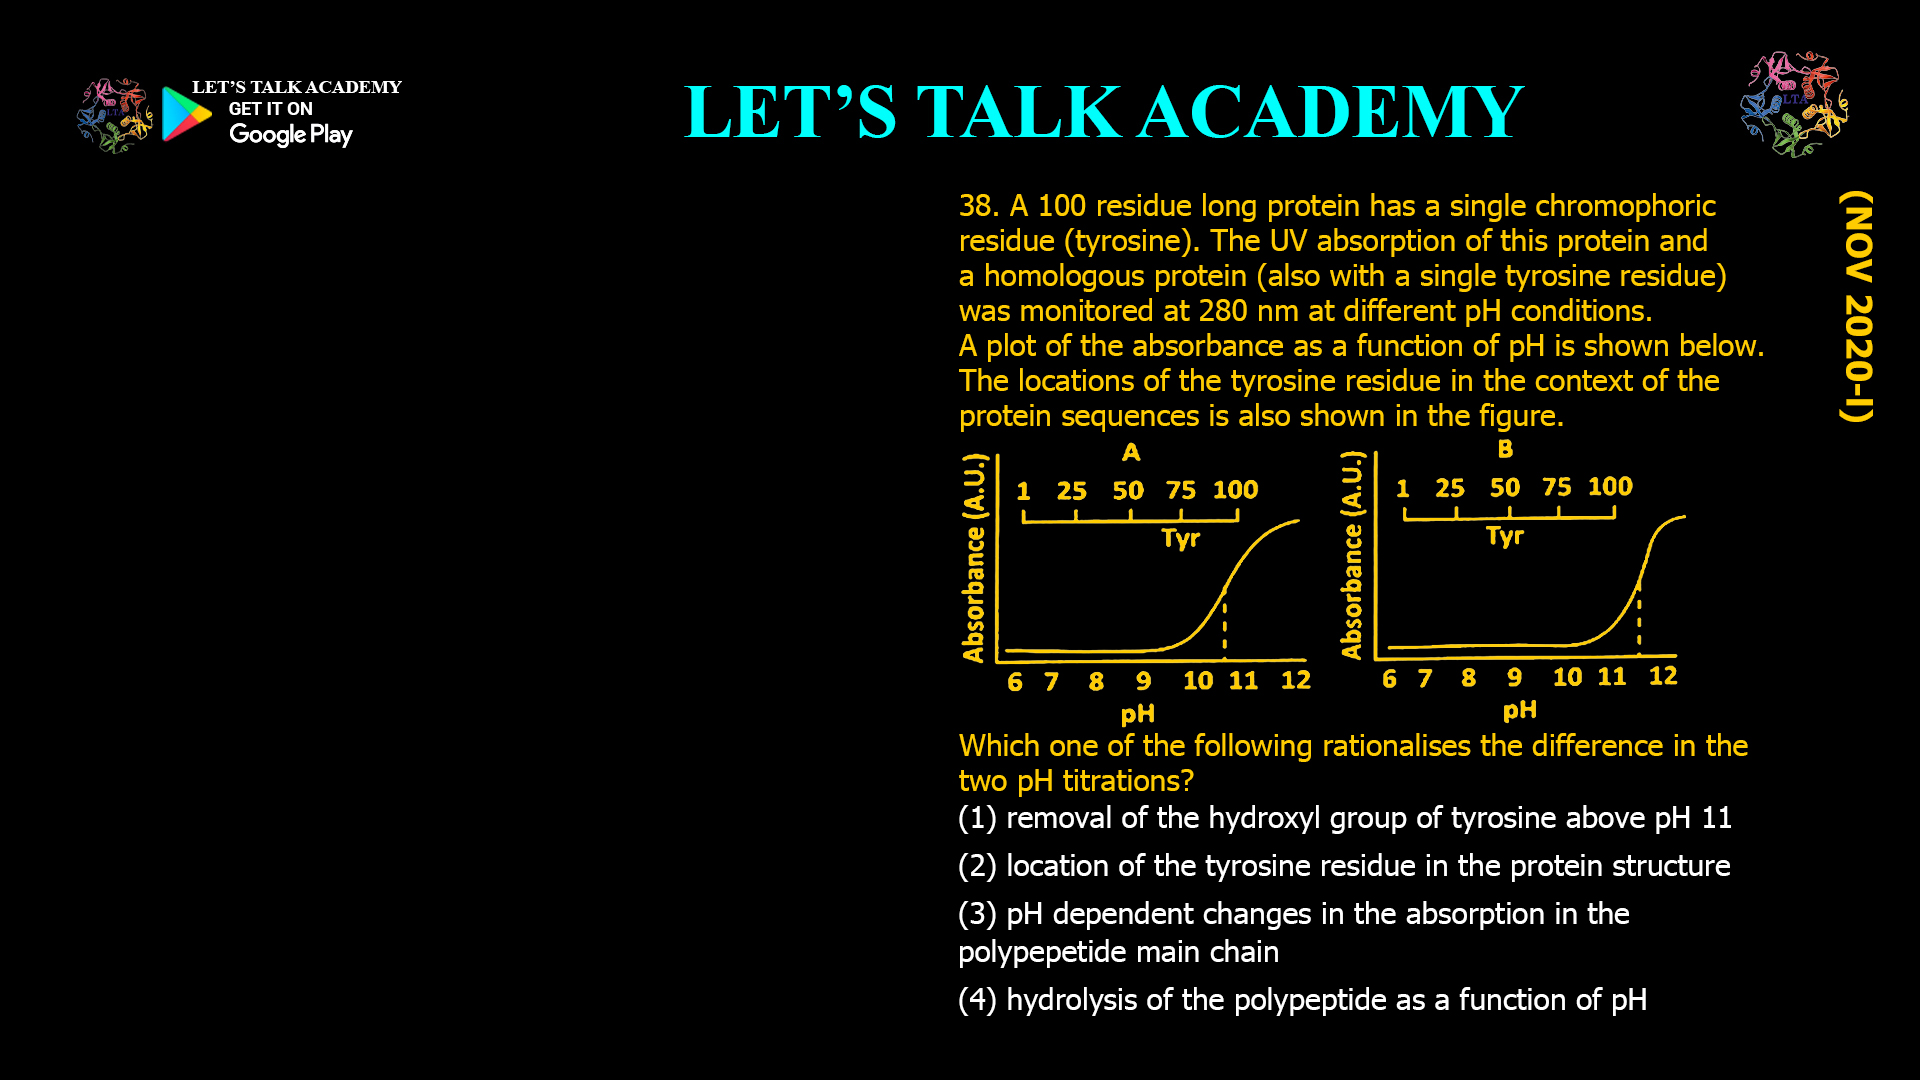
38. A 100 residue long protein has a single chromophoric residue (tyrosine). The UV absorption of this protein and a homologous protein (also with a single tyrosine residue) was monitored at 280 nm at different pH conditions. A plot of the absorbance as a function of pH is shown below. The locations of the tyrosine residue in the context of the protein sequence is also shown in the figure. Which one of the following rationalises the difference in the two pH titrations? (A) Removal of the hydroxyl group of tyrosine above pH 11. (B) Location of the tyrosine residue in the protein structure. (C) pH dependent changes in the absorption in the polypeptide main chain. (D) Hydrolysis of the polypeptide as a function of pH.

Effect of Tyrosine Environment on UV Absorption

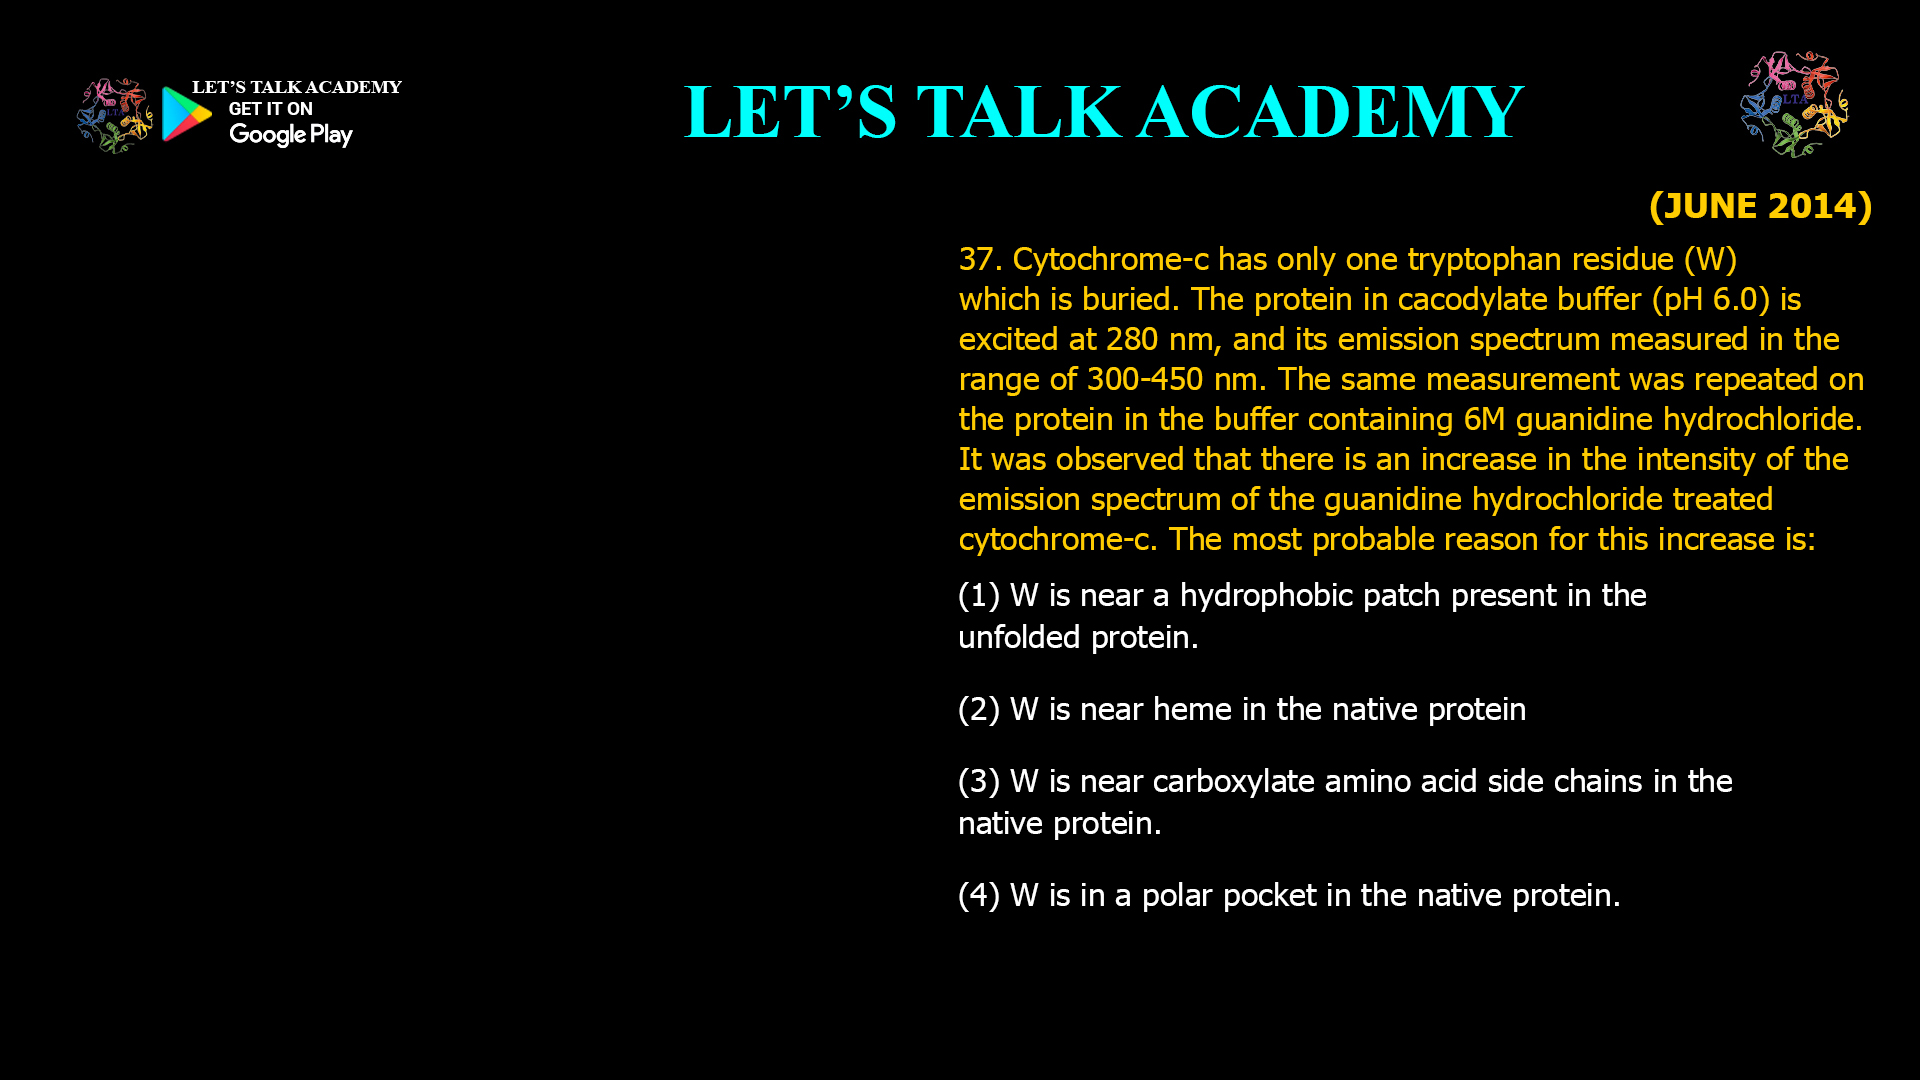
37. Cytochrome-c has only one tryptophan residue (W) which is buried. The protein in cacodylate buffer (pH 6.0) is excited at 280 nm, and its emission spectrum measured in the range of 300–450 nm. The same measurement was repeated on the protein in the buffer containing 6 M guanidine hydrochloride. It was observed that there is an increase in the intensity of the emission spectrum of the guanidine hydrochloride-treated cytochrome-c. The most probable reason for this increase is: (A) W is near a hydrophobic patch present in the unfolded protein. (B) W is near heme in the native protein. (C) W is near carboxylate amino acid side chains in the native protein. (D) W is in a polar pocket in the native protein.

Fluorescence Emission of Cytochrome-c

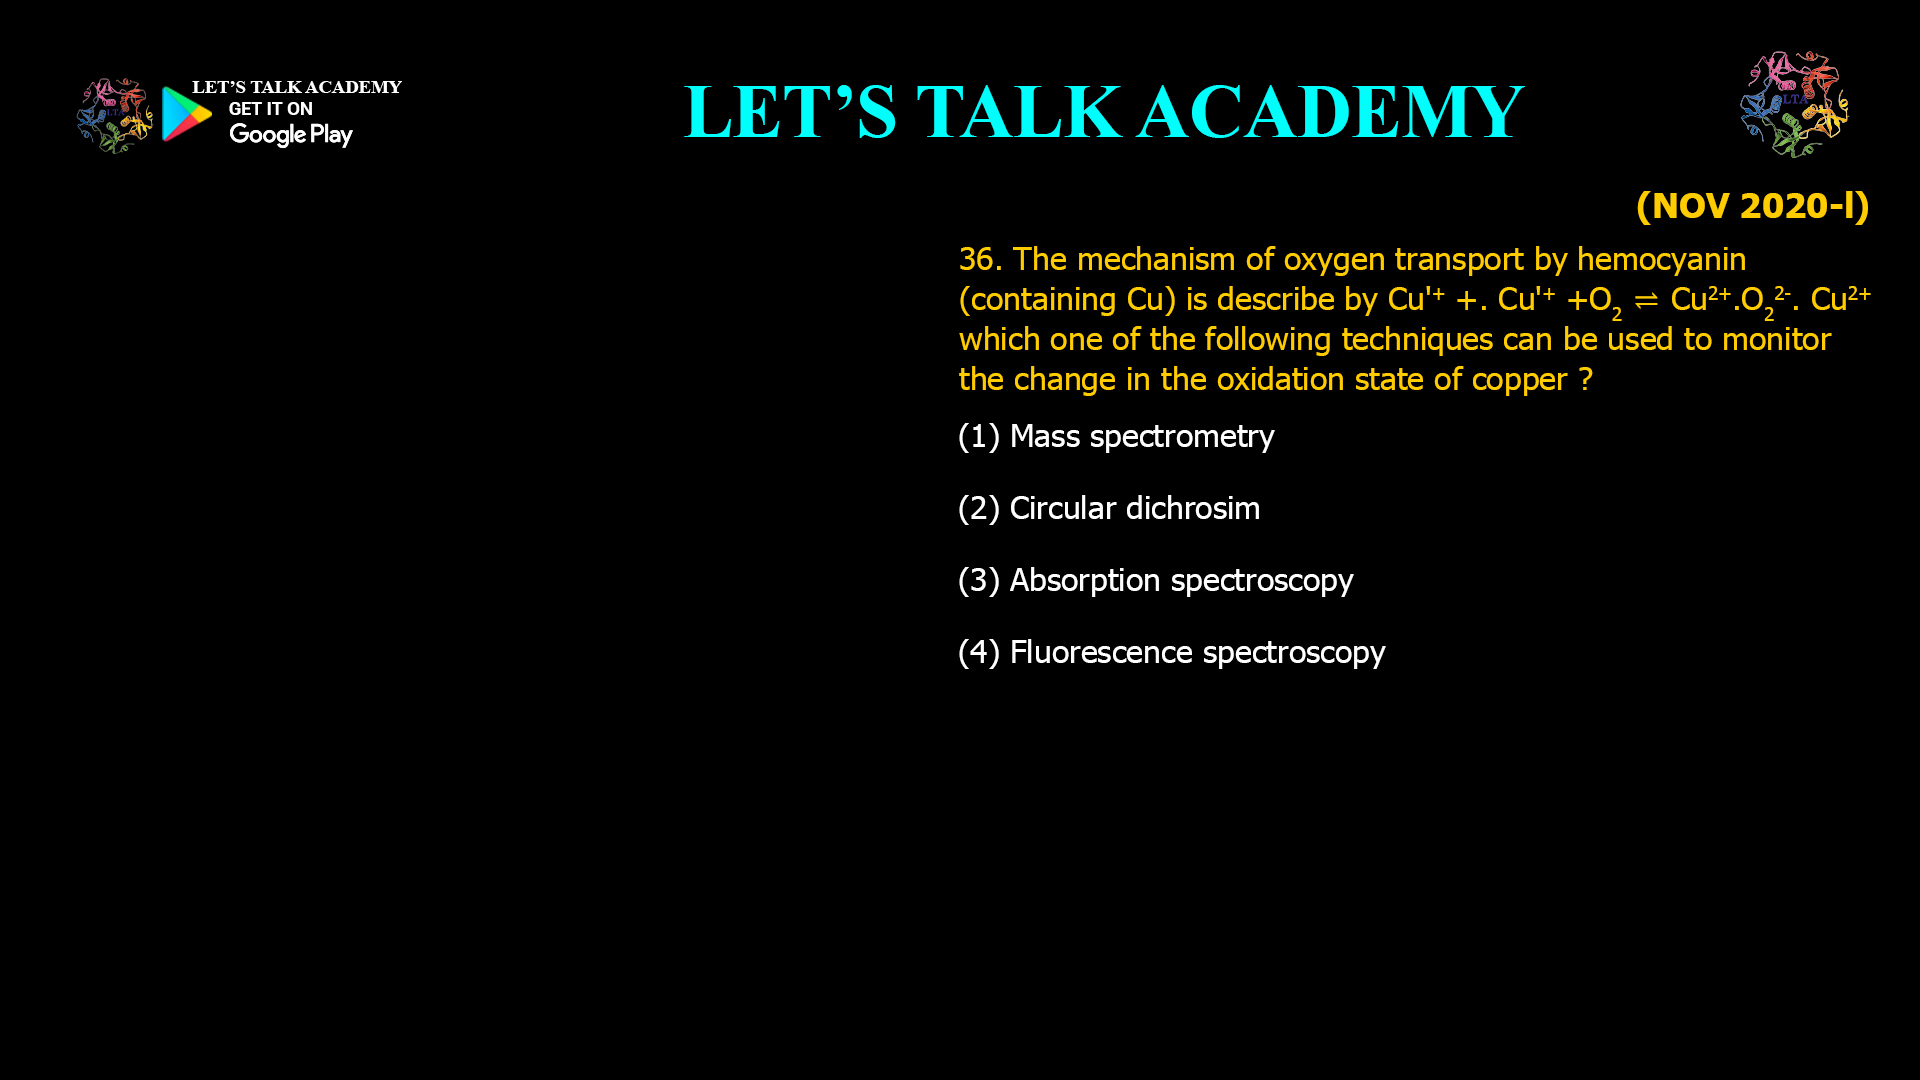
36. The mechanism of oxygen transport by hemocyanin (containing Cu) is described by: Cu⁺ + Cu⁺ + O₂ ⇌ Cu²⁺–O₂²⁻–Cu²⁺ Which one of the following techniques can be used to monitor the change in the oxidation state of copper? (A) Mass spectrometry (B) Circular dichroism (C) Absorption spectroscopy (D) Fluorescence spectroscopy

Monitoring Copper Oxidation State

35. Which of the following atomic nuclei cannot be probed by nuclear magnetic resonance spectroscopy? (A) ¹H (B) ³¹P (C) ¹⁸O (D) ¹⁵N

Nuclei That Can and Cannot Be Studied

34. Haemoglobin has characteristic circular dichroism (CD) peaks in the far-UV, near UV and Soret regions. Contribution to near-UV CD comes entirely from (A) Aromatic amino acid residues. (B) Heme group. (C) Heme and aromatic amino acid residues. (D) Peptide bonds and aromatic amino acid residues.

Near-UV Circular Dichroism of Hemoglobin

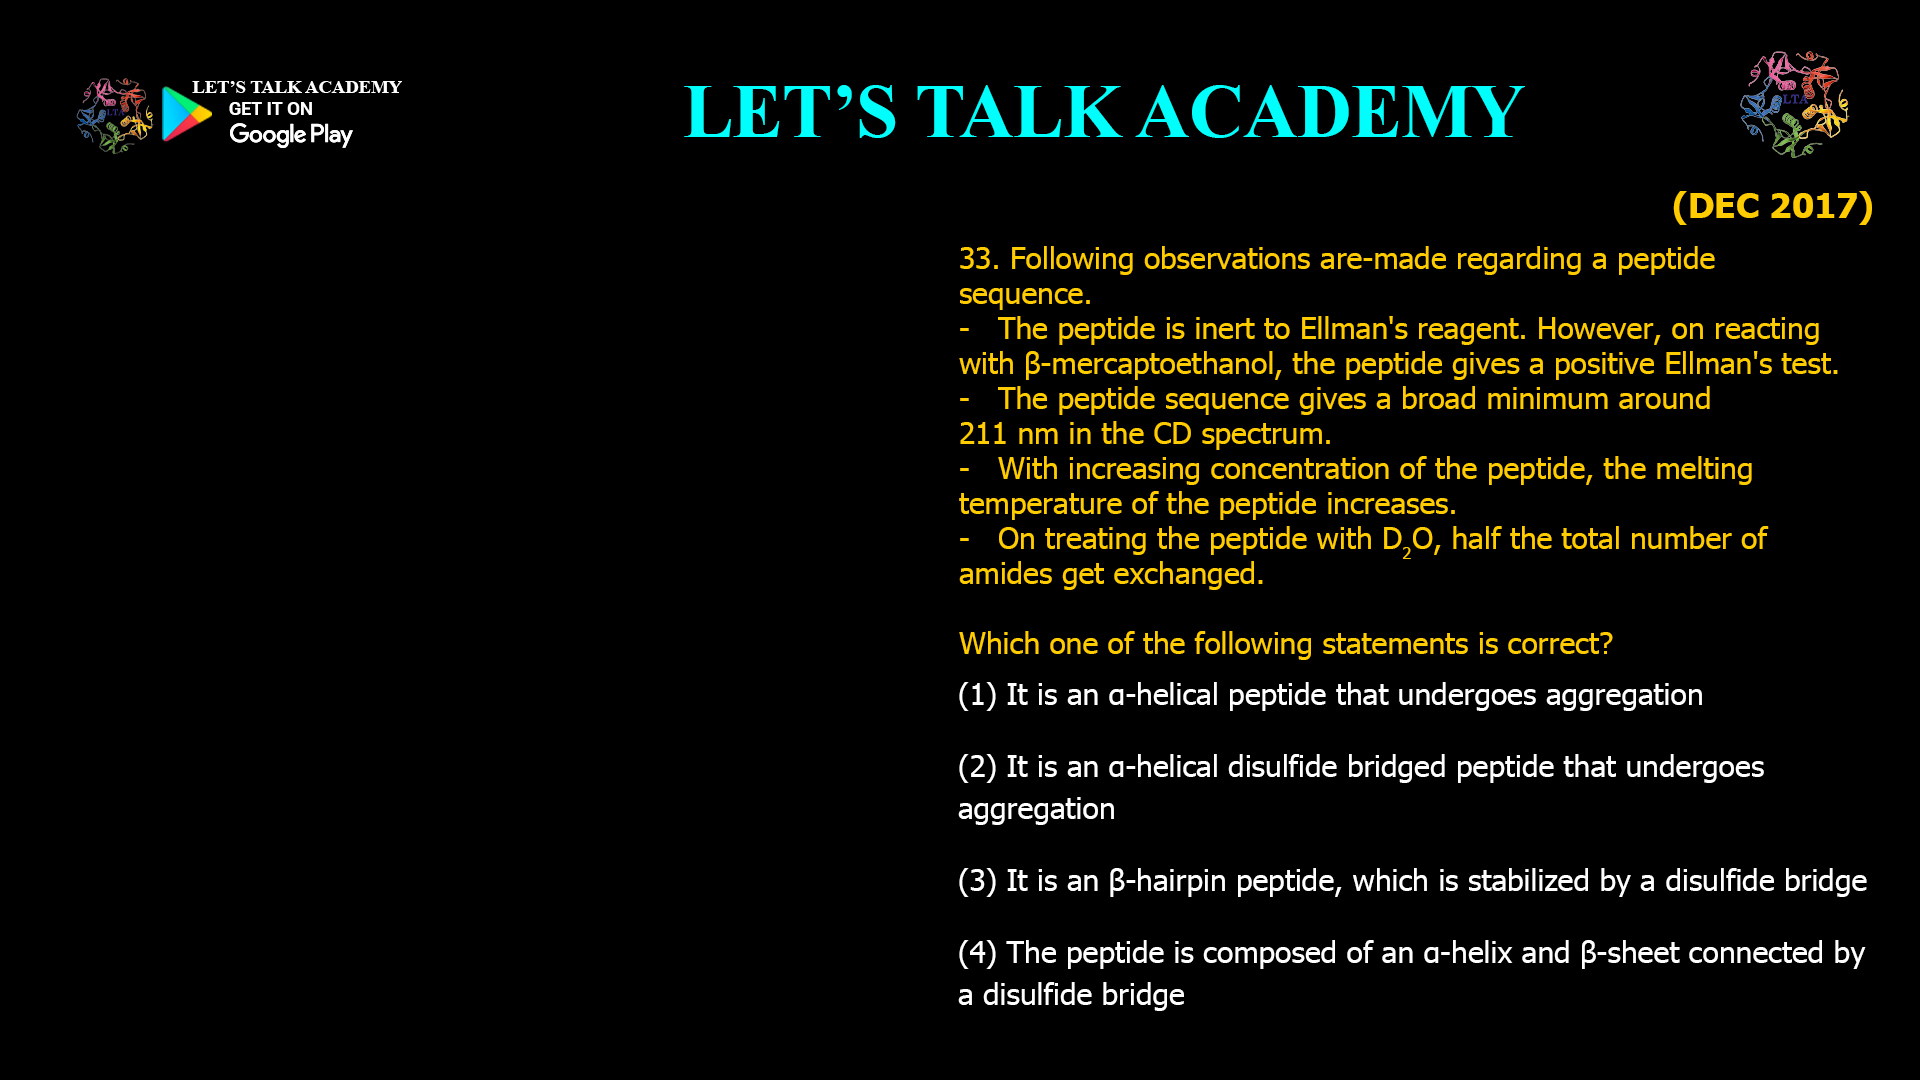
33. Following observations are made regarding a peptide sequence. - The peptide is inert to Ellman's reagent. However, on reacting with β-mercaptoethanol, the peptide gives a positive Ellman's test. - The peptide sequence gives a broad minimum around 211 nm in the CD spectrum. - With increasing concentration of the peptide, the melting temperature of the peptide increases. - On treating the peptide with D₂O, half the total number of amides get exchanged. Which one of the following statements is correct? (A) It is an α-helical peptide that undergoes aggregation. (B) It is an α-helical disulfide-bridged peptide that undergoes aggregation. (C) It is a β-hairpin peptide, which is stabilized by a disulfide bridge. (D) The peptide is composed of an α-helix and β-sheet connected by a disulfide bridge.

Identifying a Disulfide-Bridged β-Hairpin Peptide

32. Poly-L-lysine exists in pure α-helix, β-sheet and random coiled conformation depending upon the solvent conditions. The values of mean residue ellipticity at 220 nm ([Θ]₂₂₀) are −35,700, −13,800 and +3,900 deg cm² dmol⁻¹ for α-helical, β-sheet and random coil conformations of this polypeptide, respectively. The polypeptide exists in α-helix conformation at pH 10.8 and 25°C. Addition of urea leads to a two-state transition between α-helix and random coil conformation. It has been observed that [Θ]₂₂₂ of the polypeptide is −14,800 deg cm² dmol⁻¹ in the presence of 6 M urea. The percentage of the polypeptide in α-helix conformation is: (A) 37 (B) 41 (C) 47 (D) 50

Calculating Alpha-Helix Percentage

31. A polymer is synthesized from an achiral amino acid. Conformation of the polymer can be investigated by the following techniques. A. Fibre diffraction B. Nuclear magnetic resonance spectroscopy C. Circular dichroism spectroscopy D. Differential scanning calorimetry Choose the combination which would indicate that the polymer adopts a helical conformation. (A) A, C (B) B, D (C) A, B (D) C, D

Identifying Helical Conformation of a Polymer

30. At 25°C values of [Θ]₂₂₂, the mean residue ellipticity at 222 nm, are −33,000 and −3,000 deg cm² dmol⁻¹ for a polypeptide existing in α-helical (α) and β-structure (β), respectively. If this polypeptide undergoes a two-state heat-induced α → β transition, and a value of [Θ]₂₂₂ = −18,000 deg cm² dmol⁻¹ is observed at 60°C, then this observation leads to the conclusion that the α helix conversion to β-structure: (A) 40% (B) 50% (C) 55% (D) 60%

Alpha-Helix to Beta-Sheet Conversion

29. A protein polypeptide chain exists in α-helical conformation in a solvent and it has a value of −30,000 deg cm² dmol⁻¹ for the mean residue ellipticity at 222 nm ([Θ]₂₂₂) in the temperature range 20–50°C. On raising the temperature above 50°C, [Θ]₂₂₂ increases and reaches a value of −2,000 deg cm² dmol⁻¹ at 70°C and the value of [Θ]₂₂₂ remains unchanged above 70°C. The observed value of [Θ]₂₂₂ is −14,000 deg cm² dmol⁻¹ at 60°C. If one assumes that the heat-induced denaturation is a two-state process, the fraction of α-helix at 60°C is (A) 0.40 (B) 0.43 (C) 0.50 (D) 0.57

Fraction of Alpha-Helix from Circular Dichroism Ellipticity

28. A 26-residue peptide composed of alanine and leucine shows a circular dichroism (CD) spectrum characteristic of α-helix at 50°C in 5 mM phosphate buffer at pH 7.4. Deconvolution of the spectrum indicates 60% α-helical and 40% random conformation. When the peptide solution is cooled gradually to 25°C, and the CD spectra are recorded at different temperatures, the most likely observation will be that (A) The % helical content will decrease and % random conformation will increase. (B) The % helical content will increase and % random conformation will decrease. (C) There will be transition from α-helix to β-sheet. (D) There will be transition from α-helix to β-hairpin.

Alpha-Helix Stability During Cooling in Circular Dichroism

27. Which one of the following statements is correct? (1) Electrospray ionization mass spectrum of a compound can be obtained only if it has a net positive charge at pH 7.4 (2) Helical content of a tryptophan containing peptide can be obtained by examining the fluorescence spectrum of tryptophan (3) The occurrence of beta sheet in a protein can be inferred from its circular dichroism spectrum (4) The chemical shift spread for a compound is more in its 1H NMR spectrum as compared to its 13C NMR spectrum

How Circular Dichroism Identifies Beta-Sheet Structure

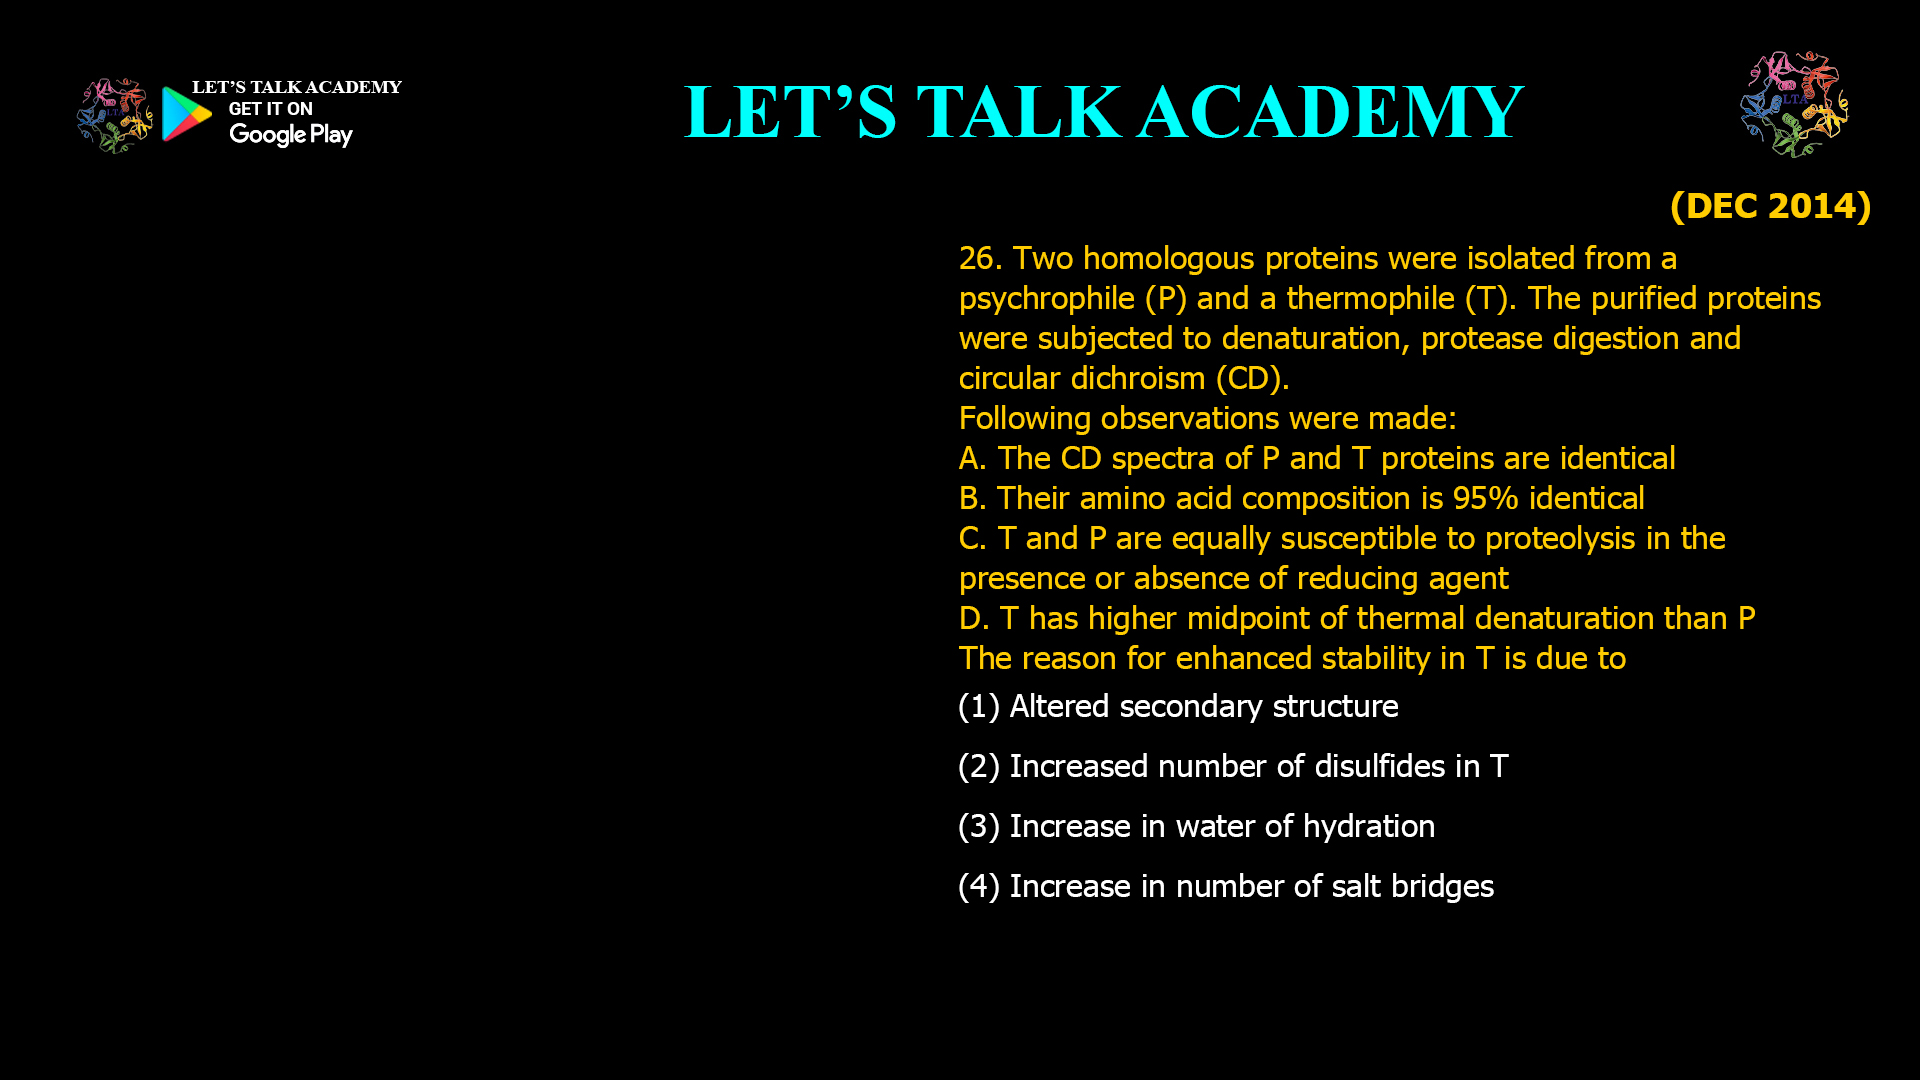
26. Two homologous proteins were isolated from a psychrophile (P) and a thermophile (T). The purified proteins were subjected to denaturation, protease digestion and circular dichroism (CD). Following observations were made: A. The CD spectra of P and T proteins are identical B. Their amino acid composition is 95% identical C. T and P are equally susceptible to proteolysis in the presence or absence of reducing agent D. T has higher midpoint of thermal denaturation than P The reason for enhanced stability in T is due to (1) Altered secondary structure (2) Increased number of disulfides in T (3) Increase in water of hydration (4) Increase in number of salt bridges

Why Are Thermophilic Proteins More Stable

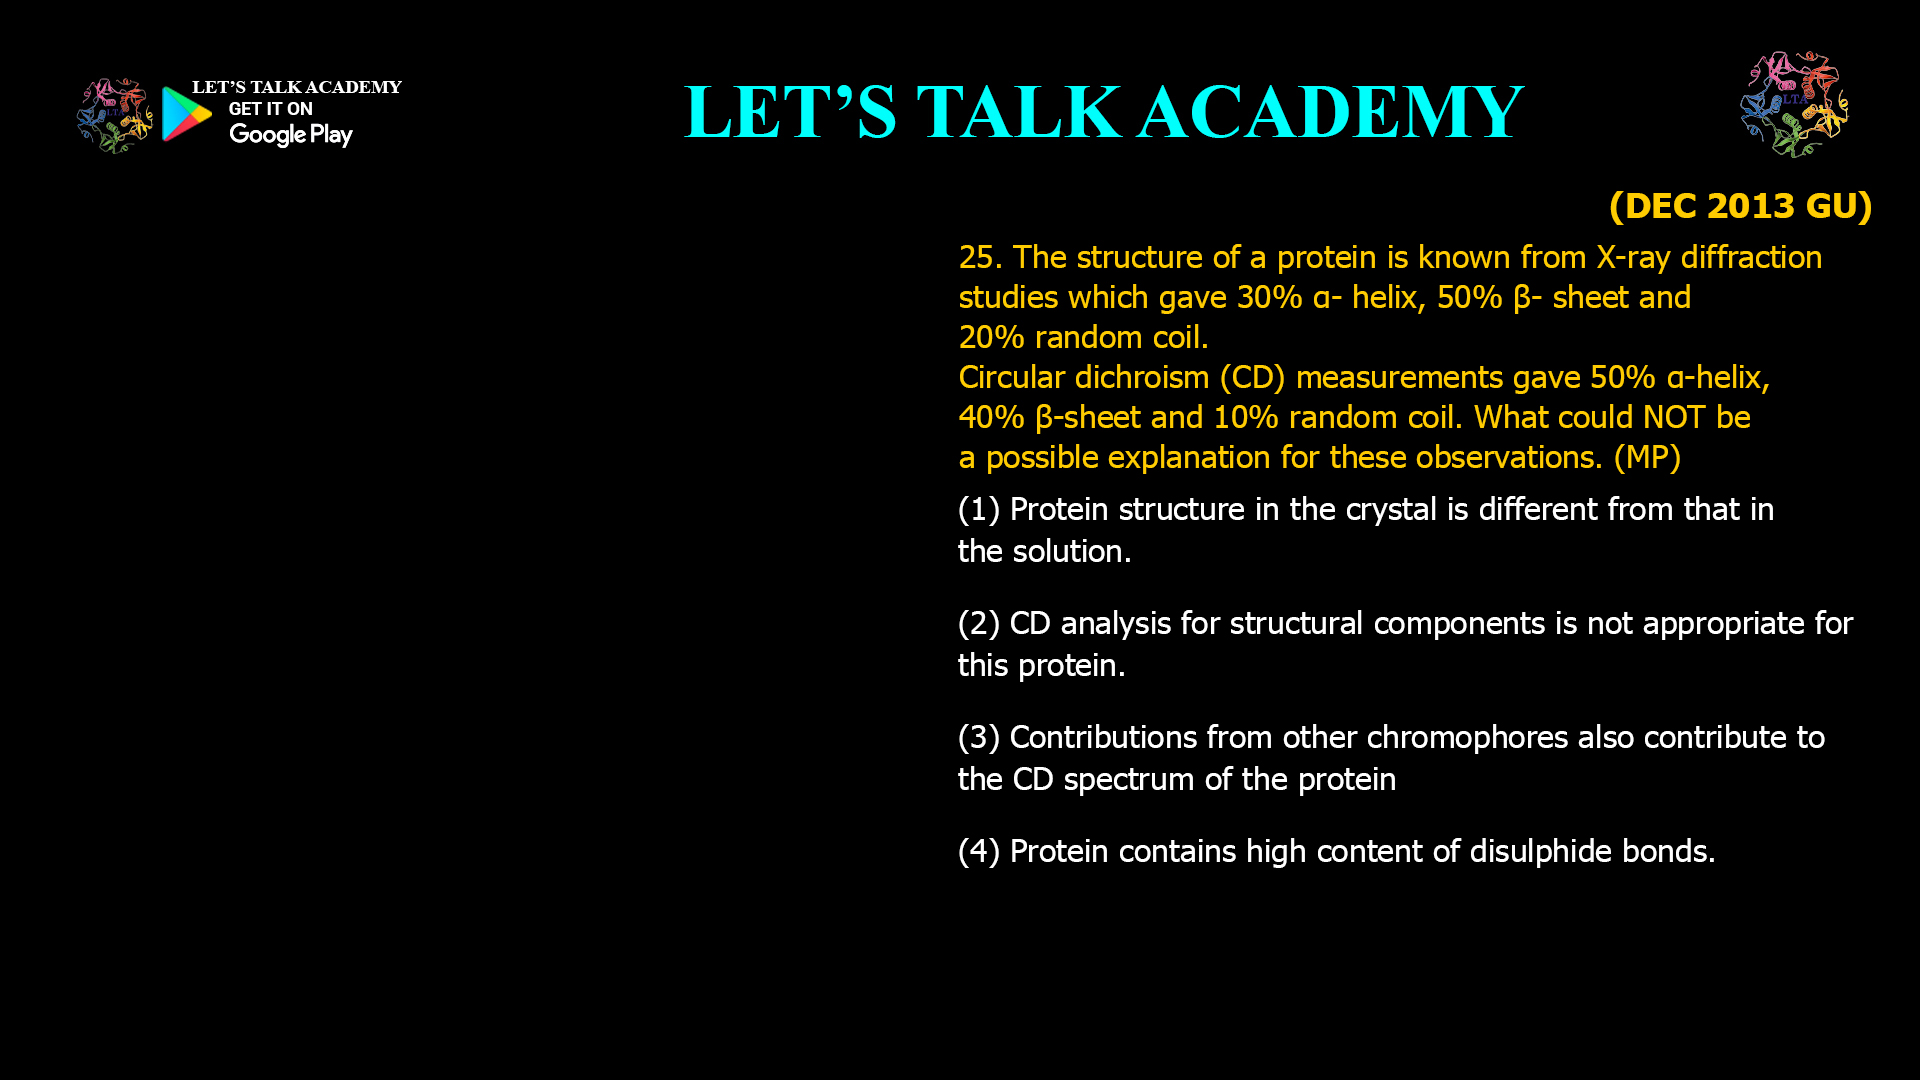
25. The structure of a protein is known from X-ray diffraction studies which gave 30% α-helix, 50% β-sheet and 20% random coil. Circular dichroism (CD) measurements gave 50% α-helix, 40% β-sheet and 10% random coil. What could NOT be a possible explanation for these observations. (MP) (1) Protein structure in the crystal is different from that in the solution. (2) CD analysis for structural components is not appropriate for this protein. (3) Contributions from other chromophores also contribute to the CD spectrum of the protein. (4) Protein contains high content of disulphide bonds.

Why Do Circular Dichroism and X-ray Diffraction

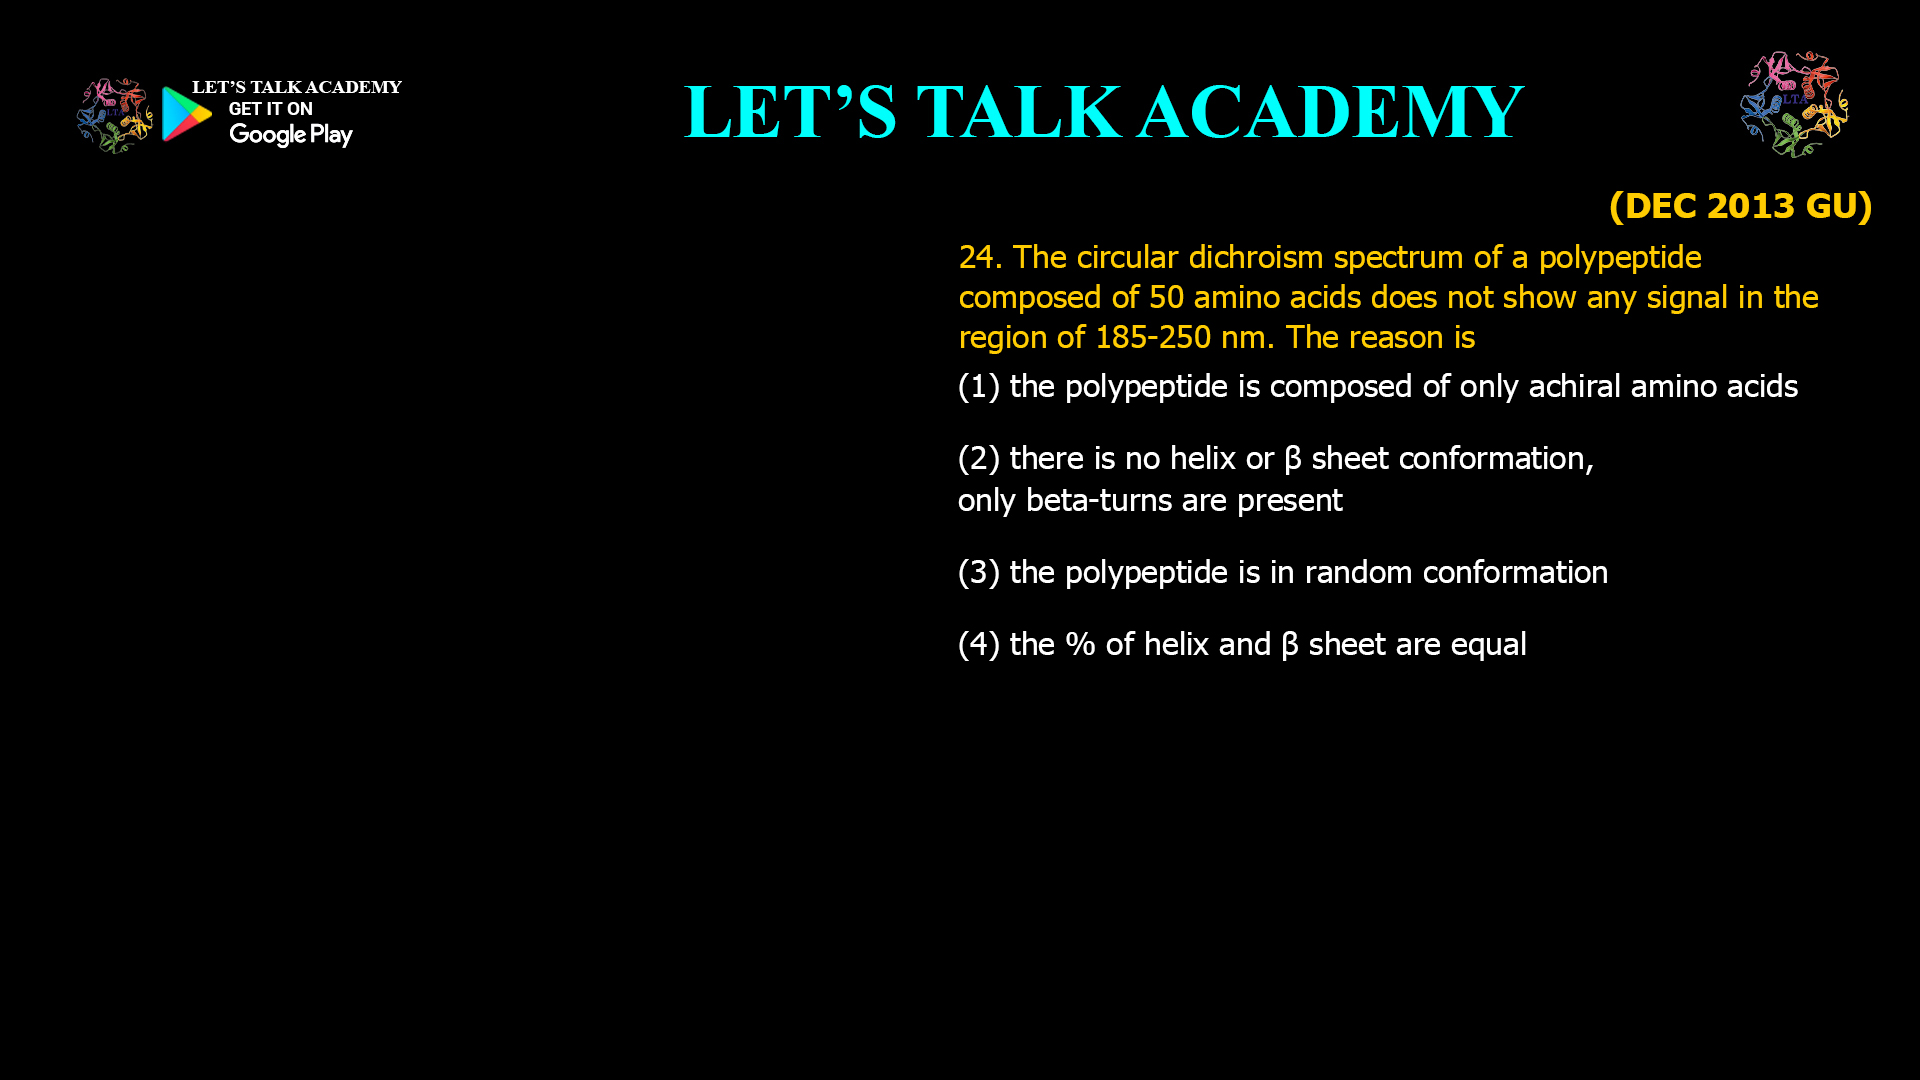
24. The circular dichroism spectrum of a polypeptide composed of 50 amino acids does not show any signal in the region of 185-250 nm. The reason is (1) the polypeptide is composed of only achiral amino acids (2) there is no helix or β sheet conformation, only beta-turns are present (3) the polypeptide is in random conformation (4) the % of helix and β sheet are equal

Why Does a Polypeptide Show No Circular Dichroism Signal

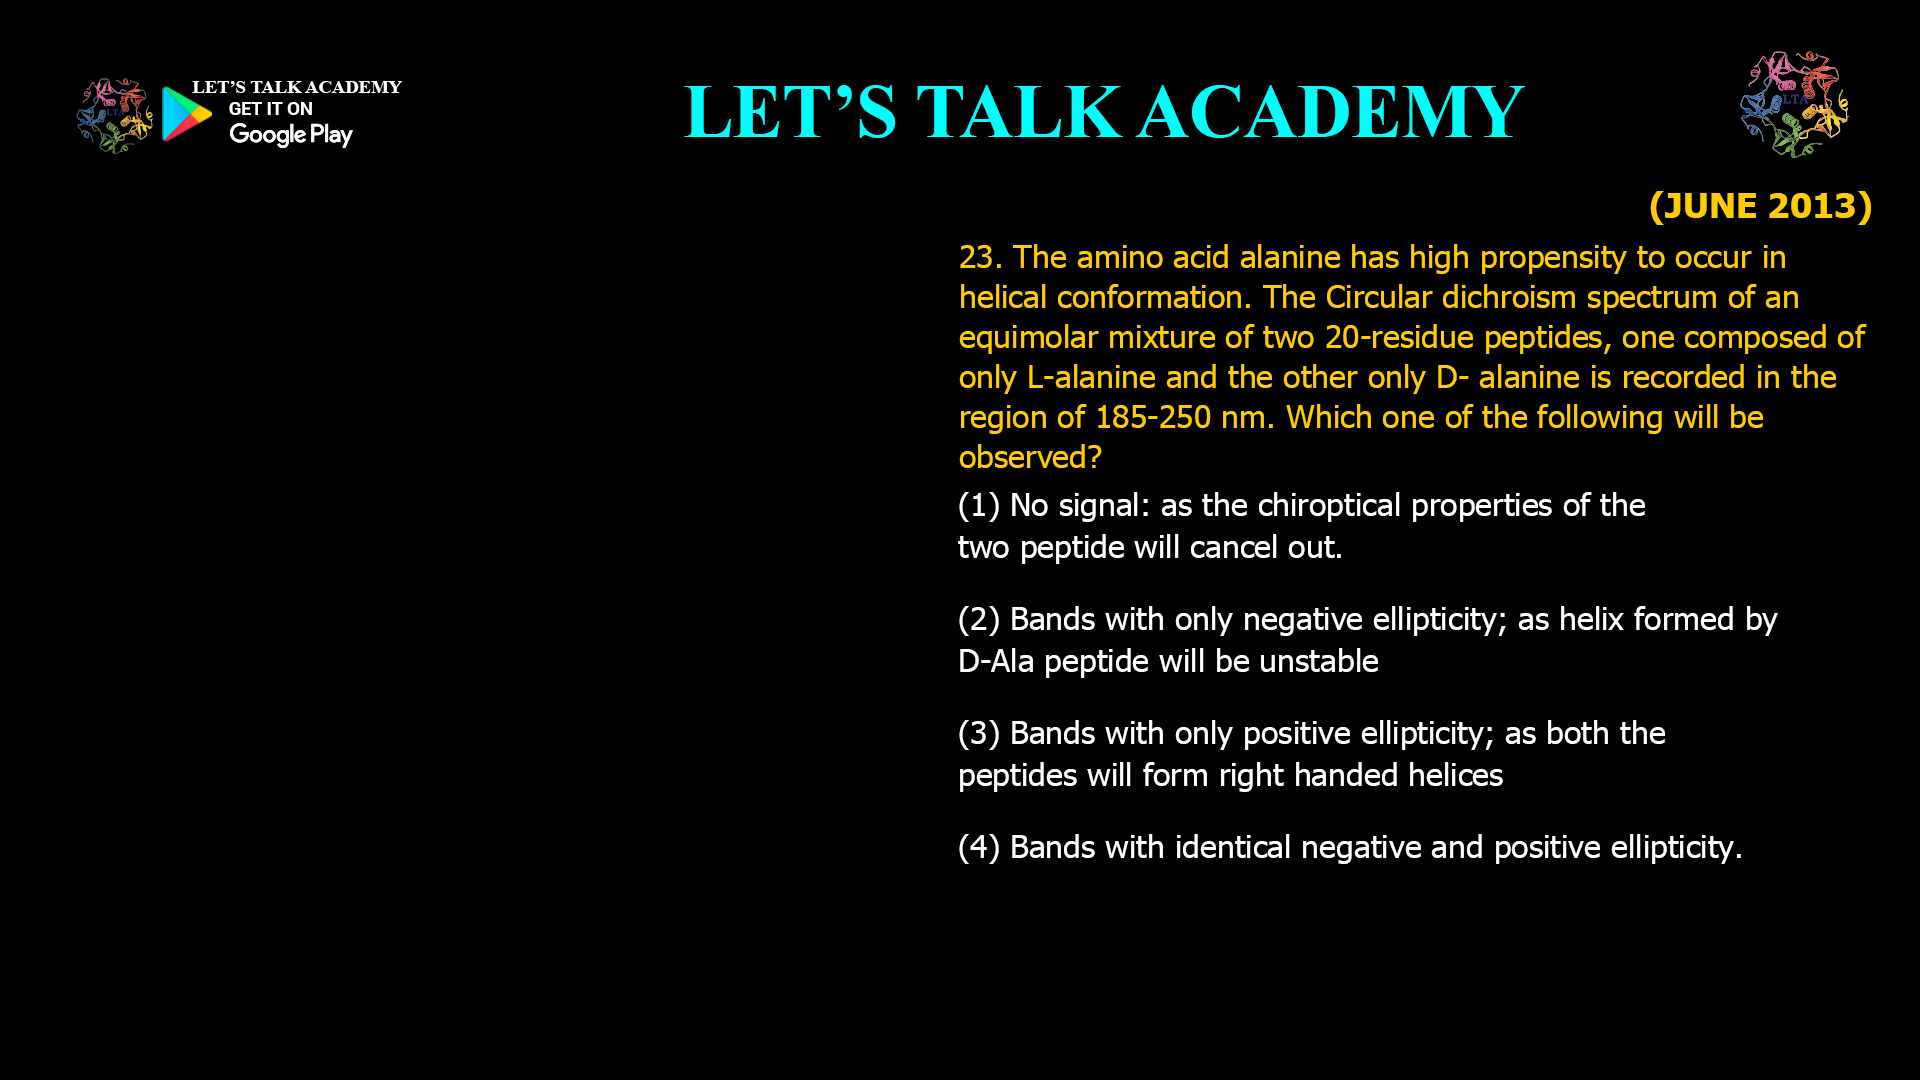
23. The amino acid alanine has high propensity to occur in helical conformation. The Circular dichroism spectrum of an equimolar mixture of two 20-residue peptides, one composed of only L-alanine and the other only D-alanine, is recorded in the region of 185-250 nm. Which one of the following will be observed? (1) No signal; as the chiroptical properties of the two peptide will cancel out. (2) Bands with only negative ellipticity; as helix formed by D-Ala peptide will be unstable. (3) Bands with only positive ellipticity; as both the peptides will form right handed helices. (4) Bands with identical negative and positive ellipticity.

Circular Dichroism Spectrum of Equimolar

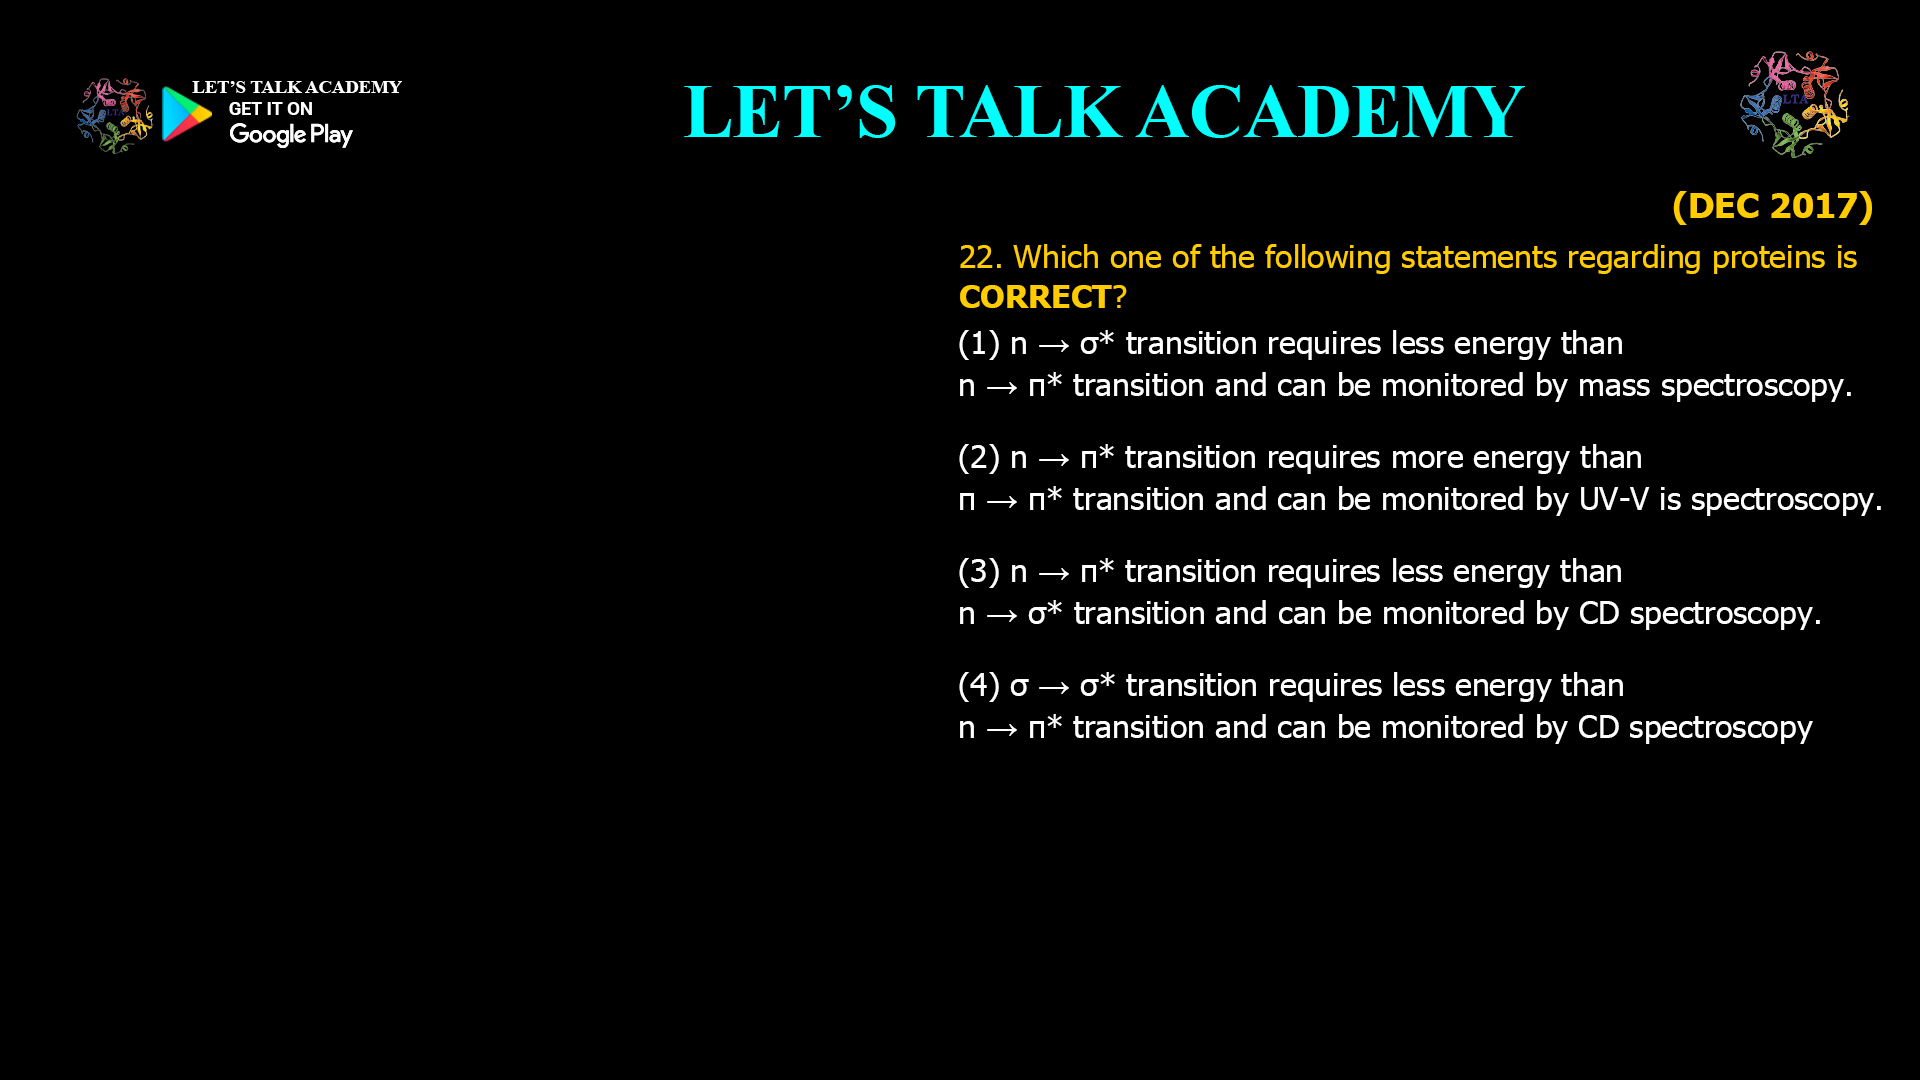
22. Which one of the following statements regarding proteins is CORRECT? (1) n → σ* transition requires less energy than n → π* transition and can be monitored by mass spectroscopy. (2) n → π* transition requires more energy than π → π* transition and can be monitored by UV-VIS spectroscopy. (3) n → π* transition requires less energy than n → σ* transition and can be monitored by CD spectroscopy. (4) σ → σ* transition requires less energy than n → π* transition and can be monitored by CD spectroscopy.

n→π vs n→σ Electronic Transition in Proteins

21. Denaturation of a highly helical protein having disulfide bridges and two phenylalanines can be monitored as a function of temperature by which one of the following techniques? (1) Recording circular dichroism spectra at various temperatures (2) Monitoring the absorbance at 214 nm at various temperatures (3) Estimating the -SH content during heat denaturation (4) Monitoring the ratio of absorbance at 214 nm and at 250 nm at various temperatures

How to Monitor Thermal Denaturation

20. An optical measurement of protein is taken both before and after digestion of the protein by a protease. In which of the following spectroscopic measurement, the signal change, i.e., before v/s after protease treatment, could be the maximum? (1) Absorbance at 280 nm (2) Circular dichroism (3) Absorbance at 340 nm (4) Fluorescence value

Which Spectroscopic Signal Changes

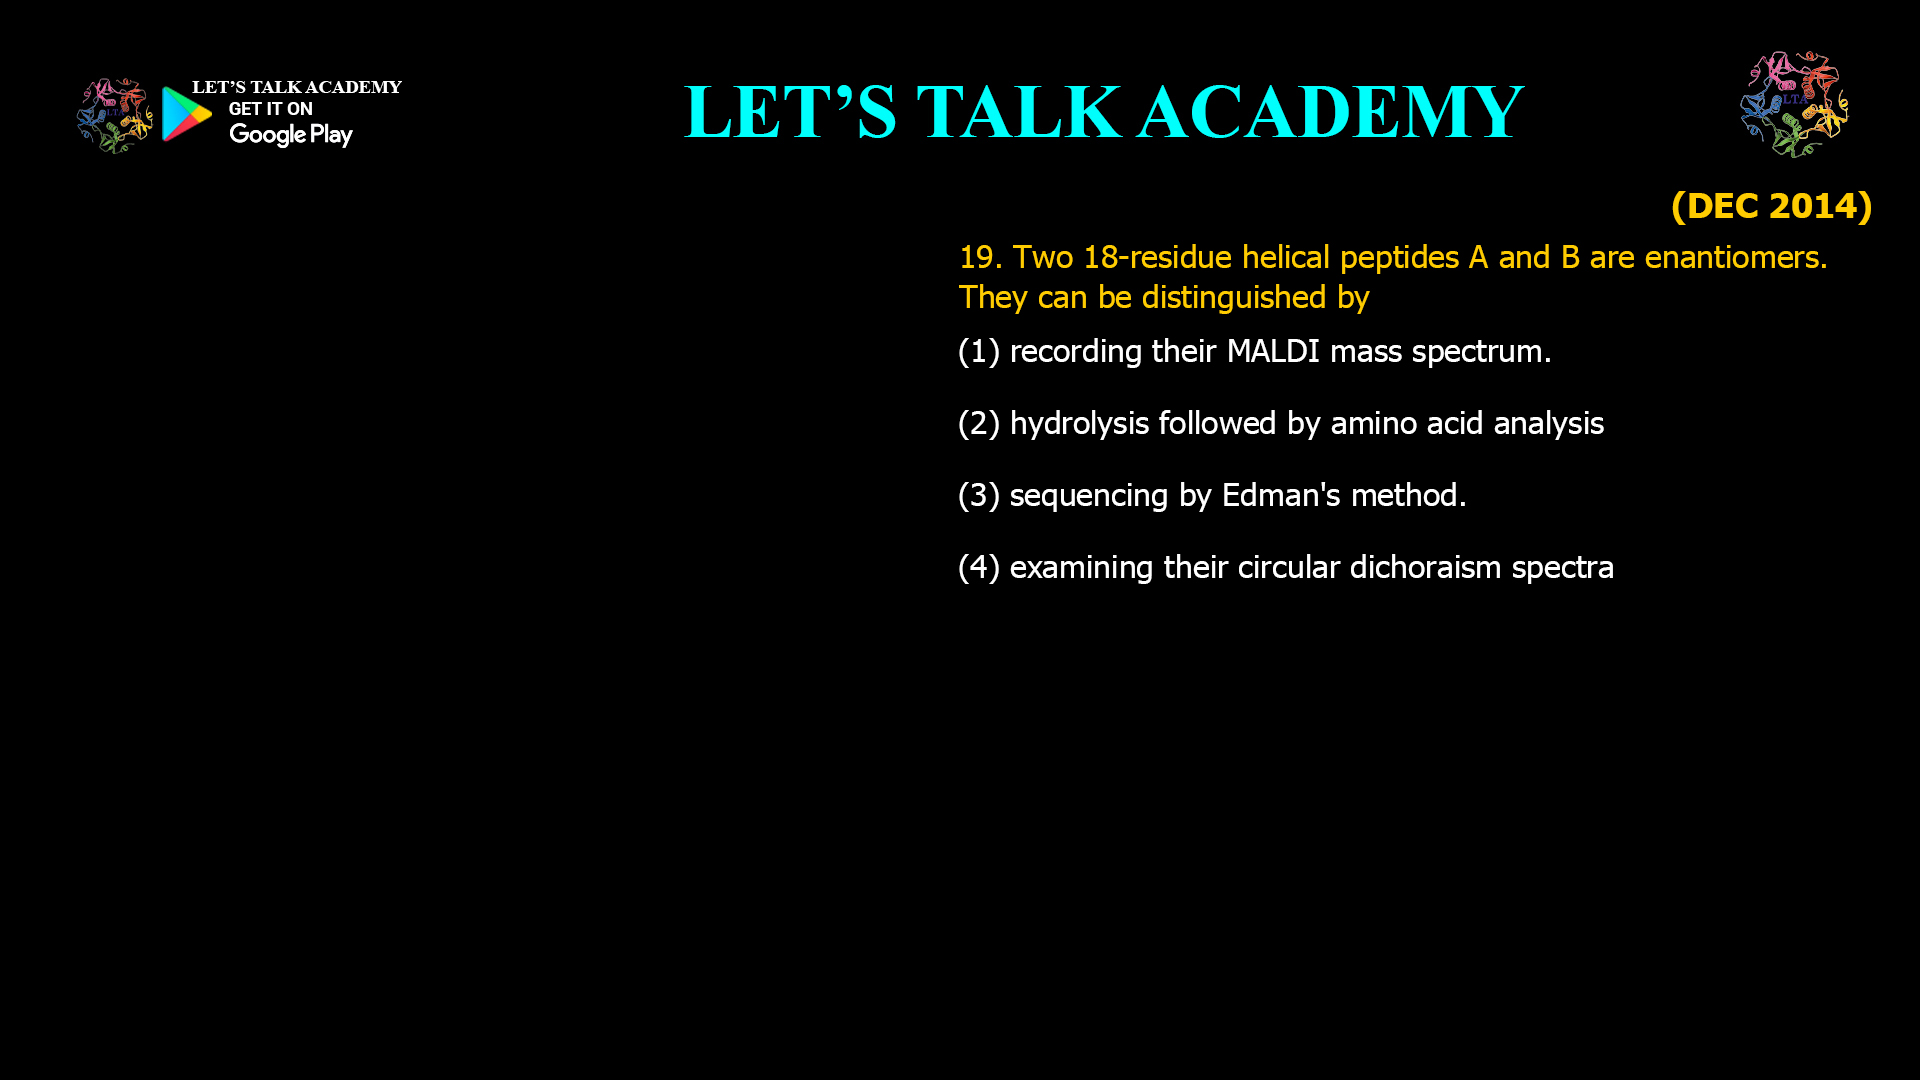
19. Two 18-residue helical peptides A and B are enantiomers. They can be distinguished by (1) recording their MALDI mass spectrum. (2) hydrolysis followed by amino acid analysis. (3) sequencing by Edman's method. (4) examining their circular dichroism spectra.

How Circular Dichroism (CD) Spectroscopy

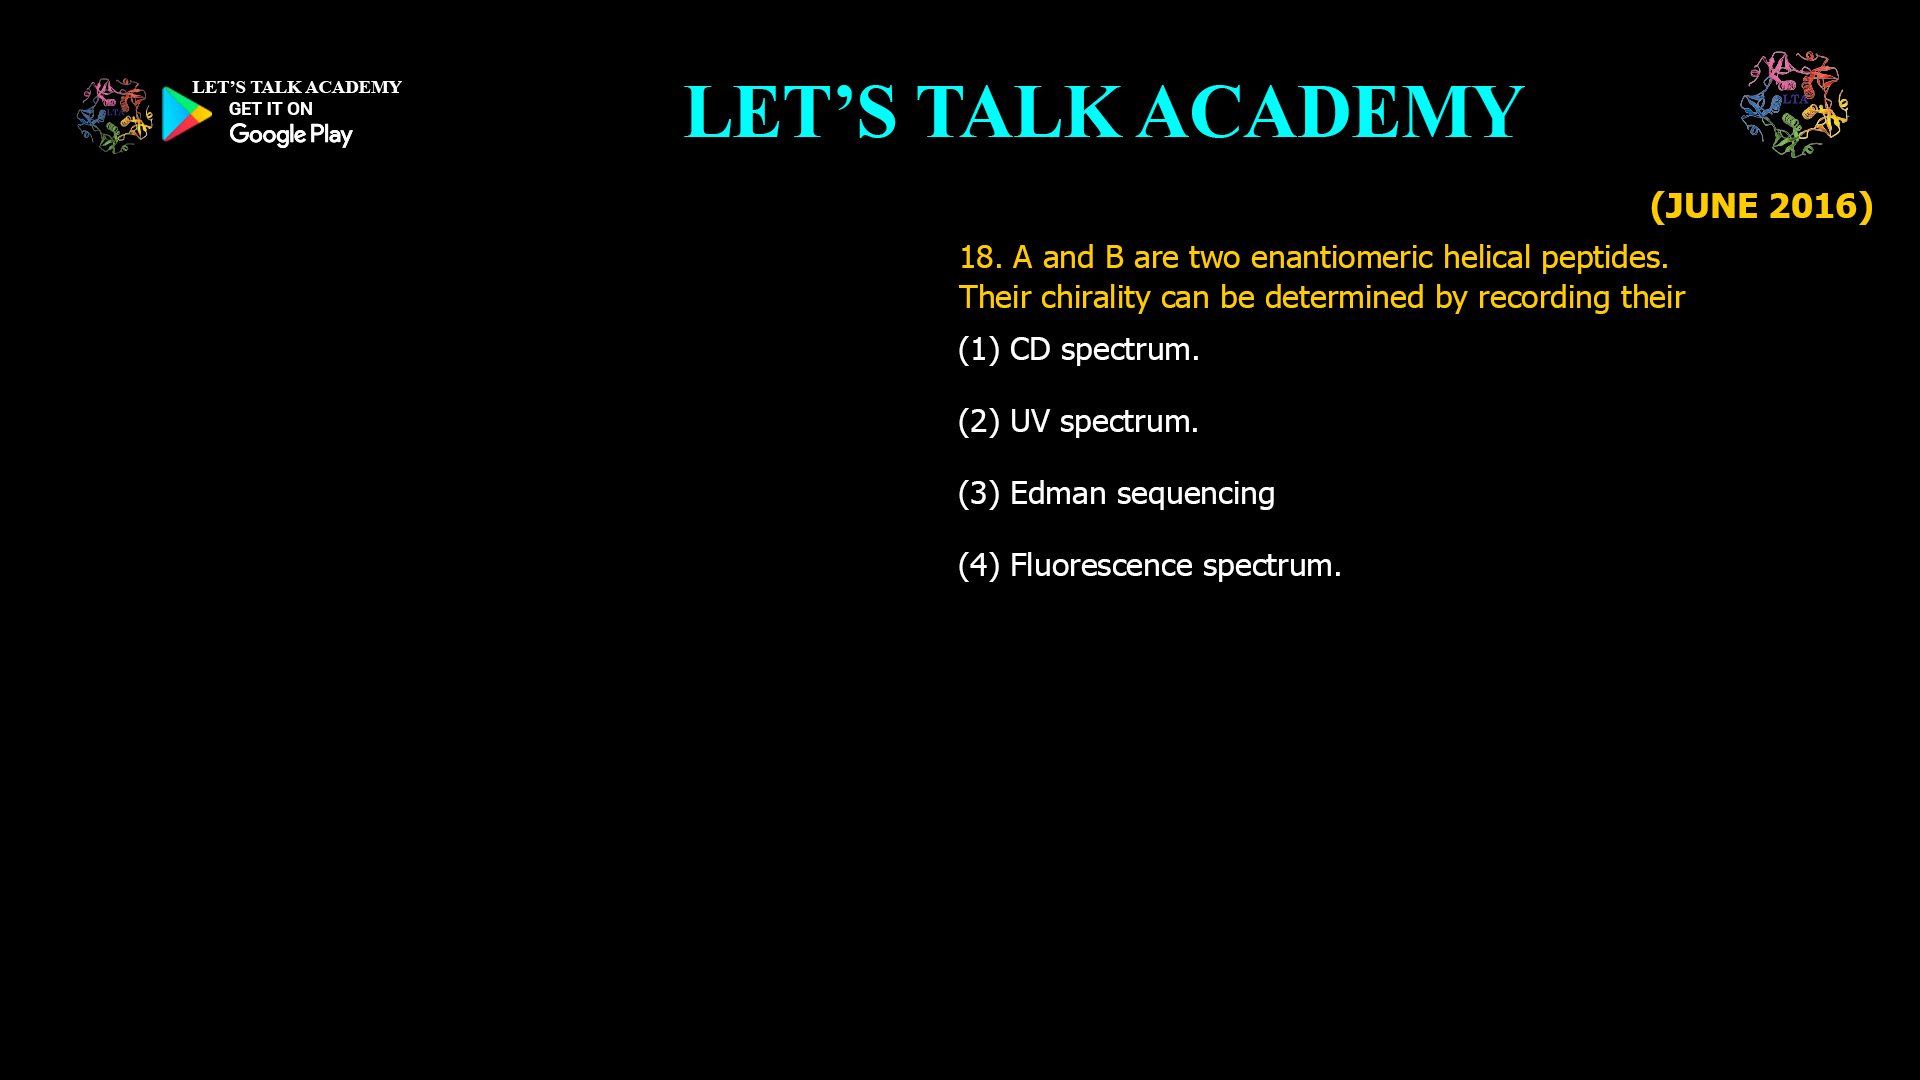
18. A and B are two enantiomeric helical peptides. Their chirality can be determined by recording their (1) CD spectrum. (2) UV spectrum. (3) Edman sequencing. (4) Fluorescence spectrum.

Why Circular Dichroism (CD) Spectroscopy

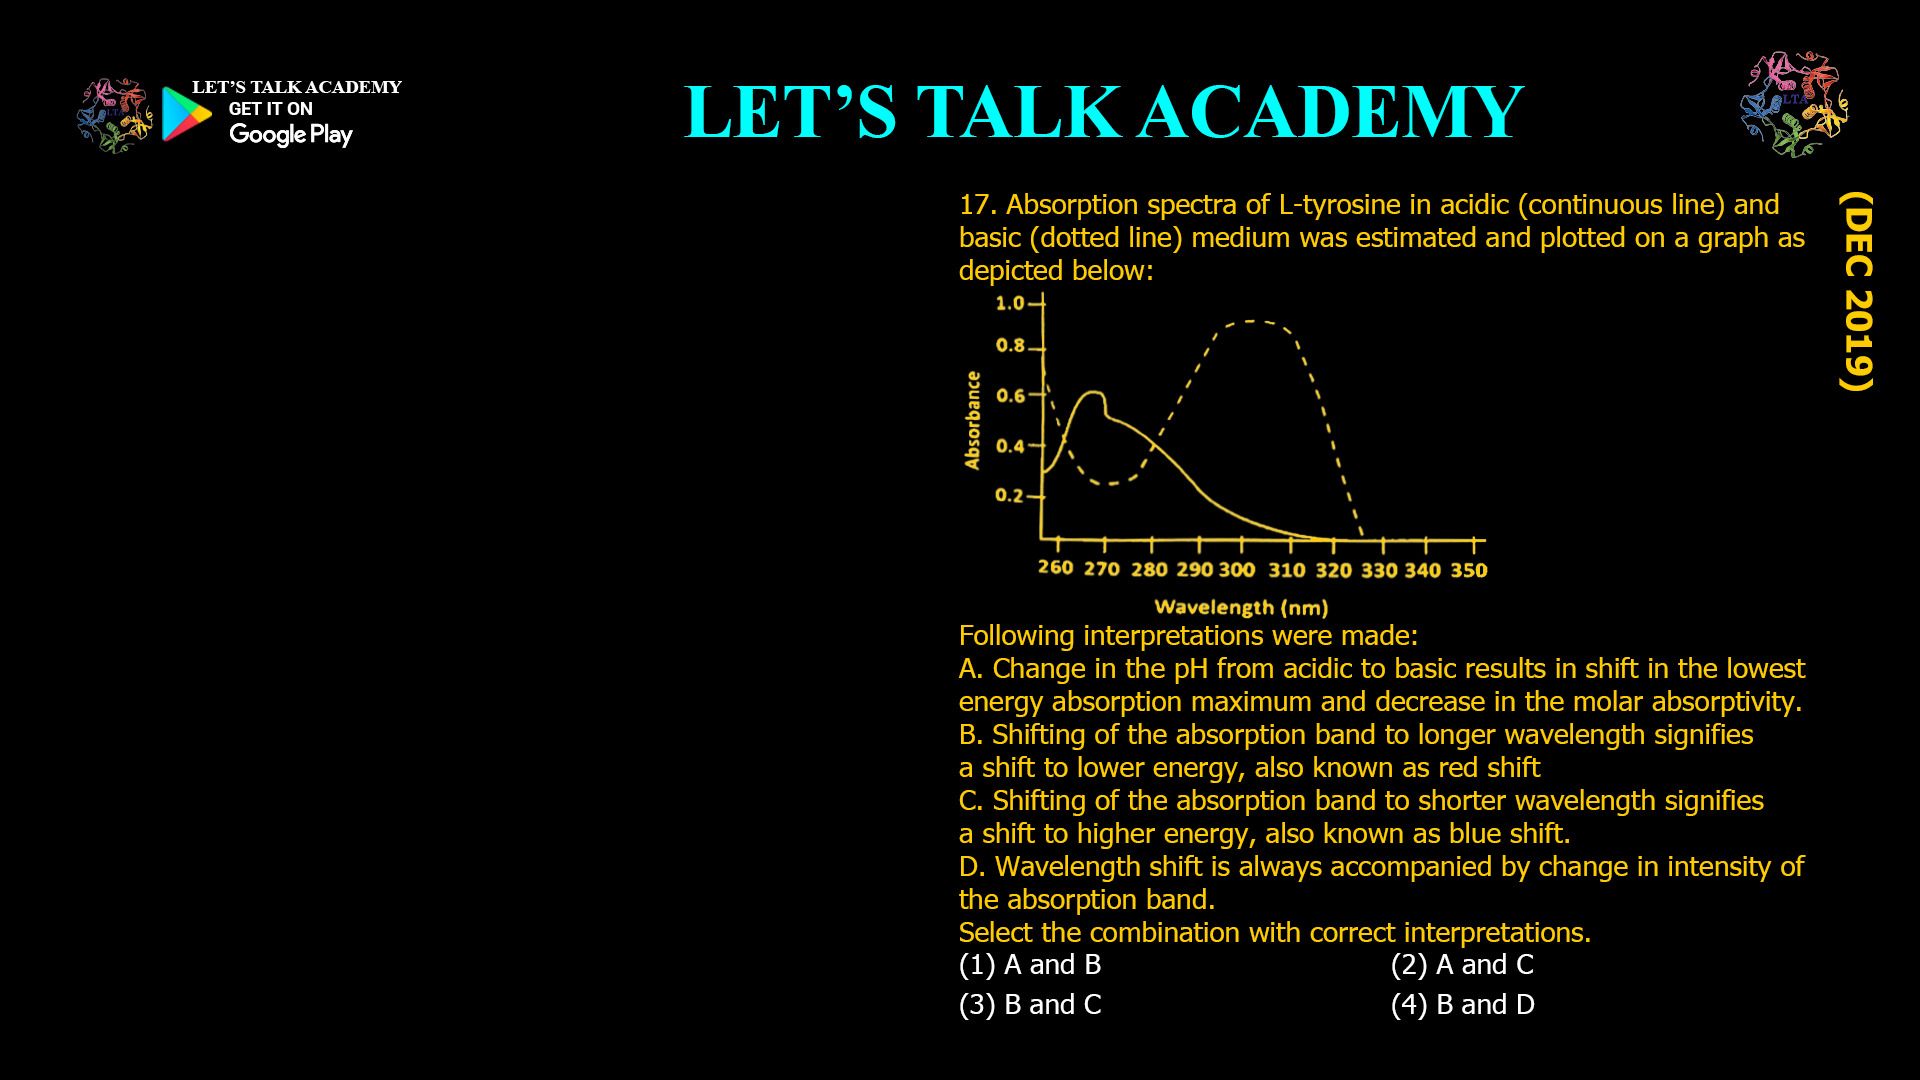
17. Absorption spectra of L-tyrosine in acidic (continuous line) and basic (dotted line) medium was estimated and plotted on a graph as depicted below: Following interpretations were made: A. Change in the pH from acidic to basic results in shift in the lowest energy absorption maximum and decrease in the molar absorptivity. B. Shifting of the absorption band to longer wavelength signifies a shift to lower energy, also known as red shift. C. Shifting of the absorption band to shorter wavelength signifies a shift to higher energy, also known as blue shift. D. Wavelength shift is always accompanied by change in intensity of the absorption band. Select the combination with correct interpretations. (1) A and B (2) A and C (3) B and C (4) B and D

Bathochromic and Hypsochromic Shift in UV-Visible Spectroscopy

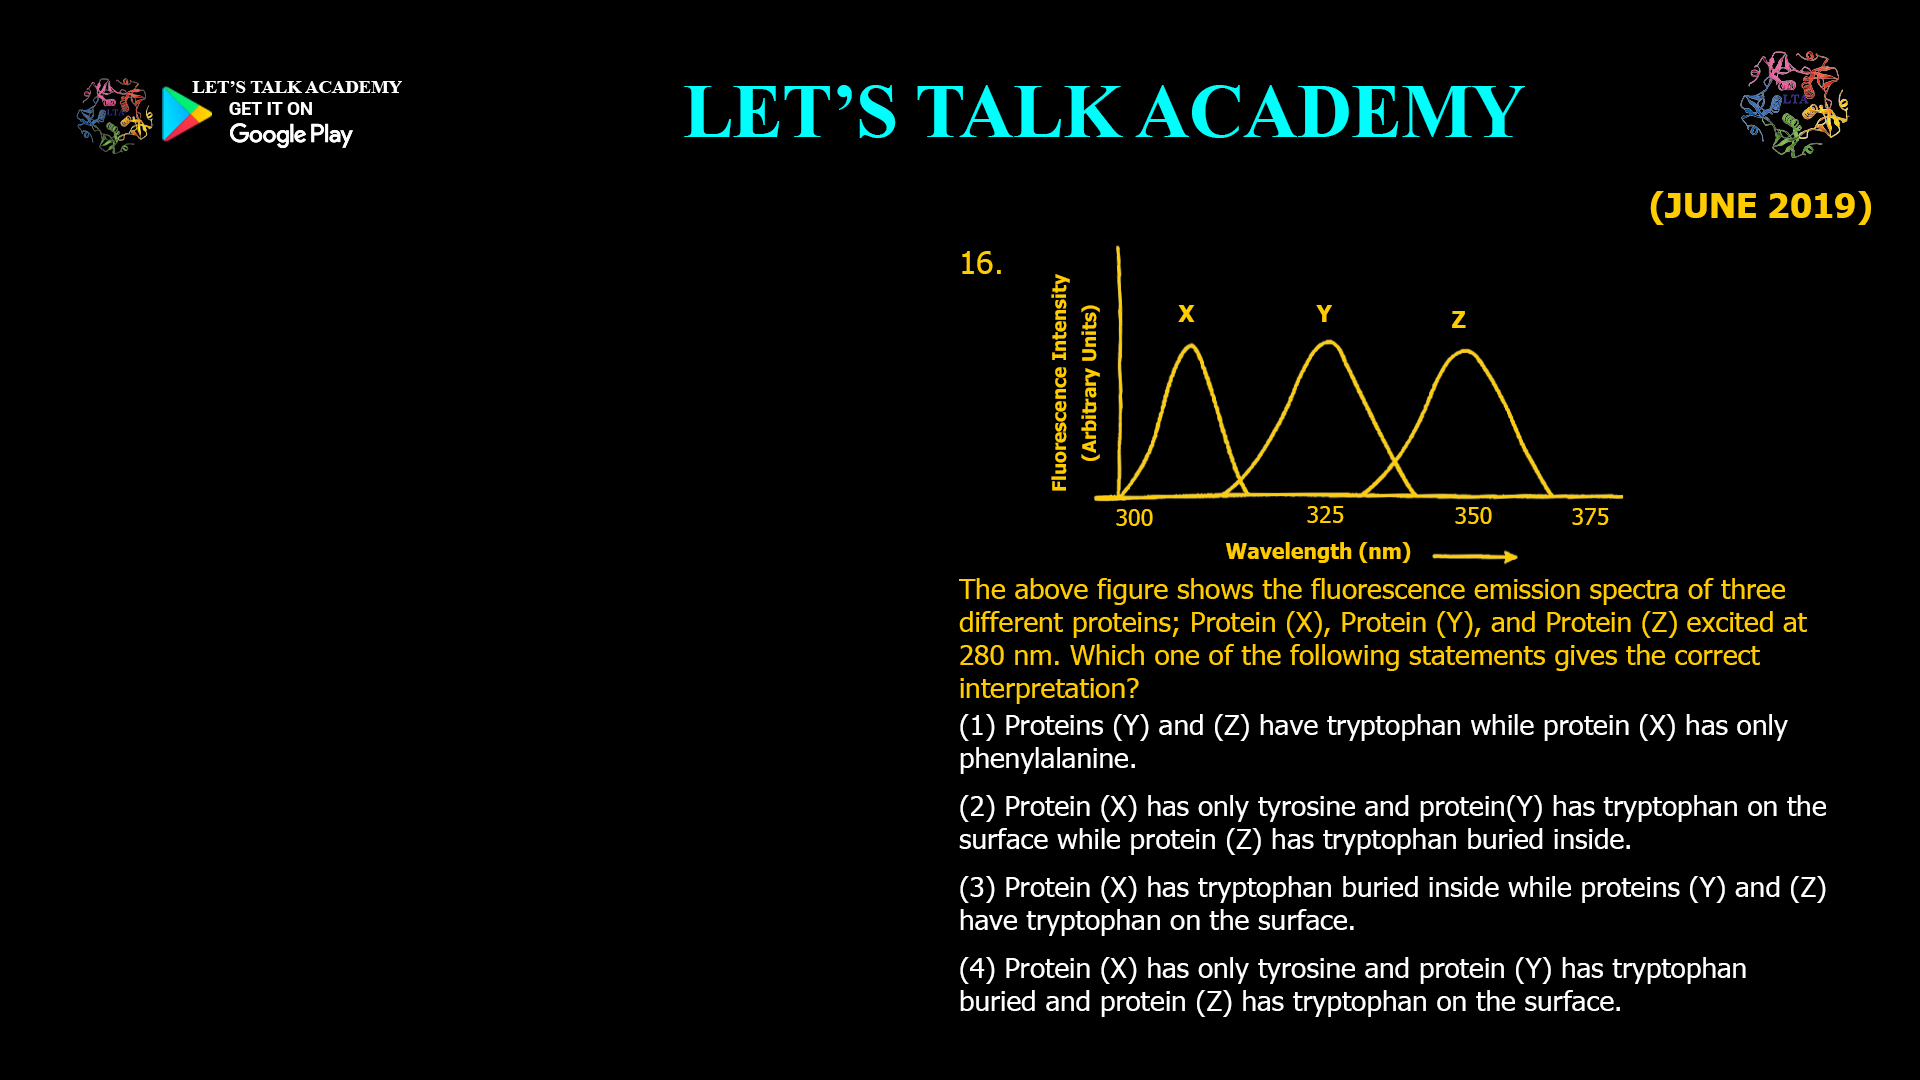
16. The above figure shows the fluorescence emission spectra of three different proteins; Protein (X), Protein (Y), and Protein (Z) excited at 280 nm. Which one of the following statements gives the correct interpretation? (1) Proteins (Y) and (Z) have tryptophan while protein (X) has only phenylalanine. (2) Protein (X) has only tyrosine and protein (Y) has tryptophan on the surface while protein (Z) has tryptophan buried inside. (3) Protein (X) has tryptophan buried inside while proteins (Y) and (Z) have tryptophan on the surface. (4) Protein (X) has only tyrosine and protein (Y) has tryptophan buried and protein (Z) has tryptophan on the surface.

How to Interpret Protein Fluorescence Emission Spectra

15. The emission maximum of tryptophan fluorescence in a protein is ~335 nm. This suggests that tryptophan (1) is in a hydrophobic environment. (2) occurs in a helical segment. (3) has proximal cysteine residues. (4) is oxidized.

Why Does Tryptophan Fluorescence at 335 nm

14. Emission maximum of a fluorophore is shifted to longer wavelength when compared to the wavelength of excitation. What is the reason? (1) Non-radiative loss of excitation energy (2) Partial absorbance of incident light (3) Scattering of light by molecules (4) Radiative loss of excitation energy

Why is Fluorescence Emission Shifted to a Longer Wavelength?

13. A solution contains NADH and NAD+, BOTH AT 0.1 mM concentration. If NADH has a molar extinction coefficient of 6220 and that of NAD+ is negligible, the optical density measured in a cuvette of 5 mm path length will be (1) 0.62 (2) 0.062 (3) 0.31 (4) 0.031

How to Calculate Optical Density (OD)

12. The values of molar absorption coefficient (ε) of Trp and Tyr at 240 nm and 280 nm are the following: Wavelength (nm) εTyr (M−1 cm−1) εTrp (M−1 cm−1) 240 11,300 1,960 280 1,500 5,380 A 10-mg sample of a protein is hydrolyzed to its constituent amino acids and diluted to 100 mL. The absorption of this solution in a 1-cm path length is 0.717 at 240 nm and 0.239 at 280 nm. The estimated content of Trp and Tyr in µmol/g protein respectively are: (1) 586 and 28.1. (2) 58.6 and 281. (3) 586 and 281. (4) 58.6 and 28.1.

How to Calculate Tryptophan and Tyrosine Content

11. A protein contains 2 Trp and 4 Tyr residues. The molecular mass of the protein is 17000 Da and that of Trp and Tyr are 204 and 180 Da, respectively. Values of E1%1cm, the absorption coefficient of 1% (g/v) solutions of Trp and Tyr in 1-cm cell at 280 nm, are 269.60 and 83.33, respectively. The absorption of 1 mg/ml protein solution in 1 cm-cell at 280 nm will be: (1) 0.1 (2) 1.0 (3) 0.7 (4) 1.7

How to Calculate Protein Absorbance at 280 nm

10. A fluorophore when transferred from solvent A to solvent B results in an increase in the number of vibrational states in the ground state without any change in the mean energies of either the ground or excited state. What would be the change seen in the fluorophore's emission spectrum? (1) An increase in emission intensity. (2) An increase in emission bandwidth. (3) An increase in emission wavelength. (4) A decrease in emission wavelength.

Fluorophore Emission Spectrum

9. The optical density (OD) of a 400 base pair long DNA solution (1 mL) was found to be 0.05. How many DNA molecules are present in the solution? Given: 1 base pair = 650 daltons Optical density of 1.0 OD corresponds to 50 µg DNA/mL (A) 6.023 × 10¹² (B) 6.023 × 10¹³ (C) 4.633 × 10¹⁸ (D) 5.2 × 10¹³

Optical Density of DNA Solution Numerical

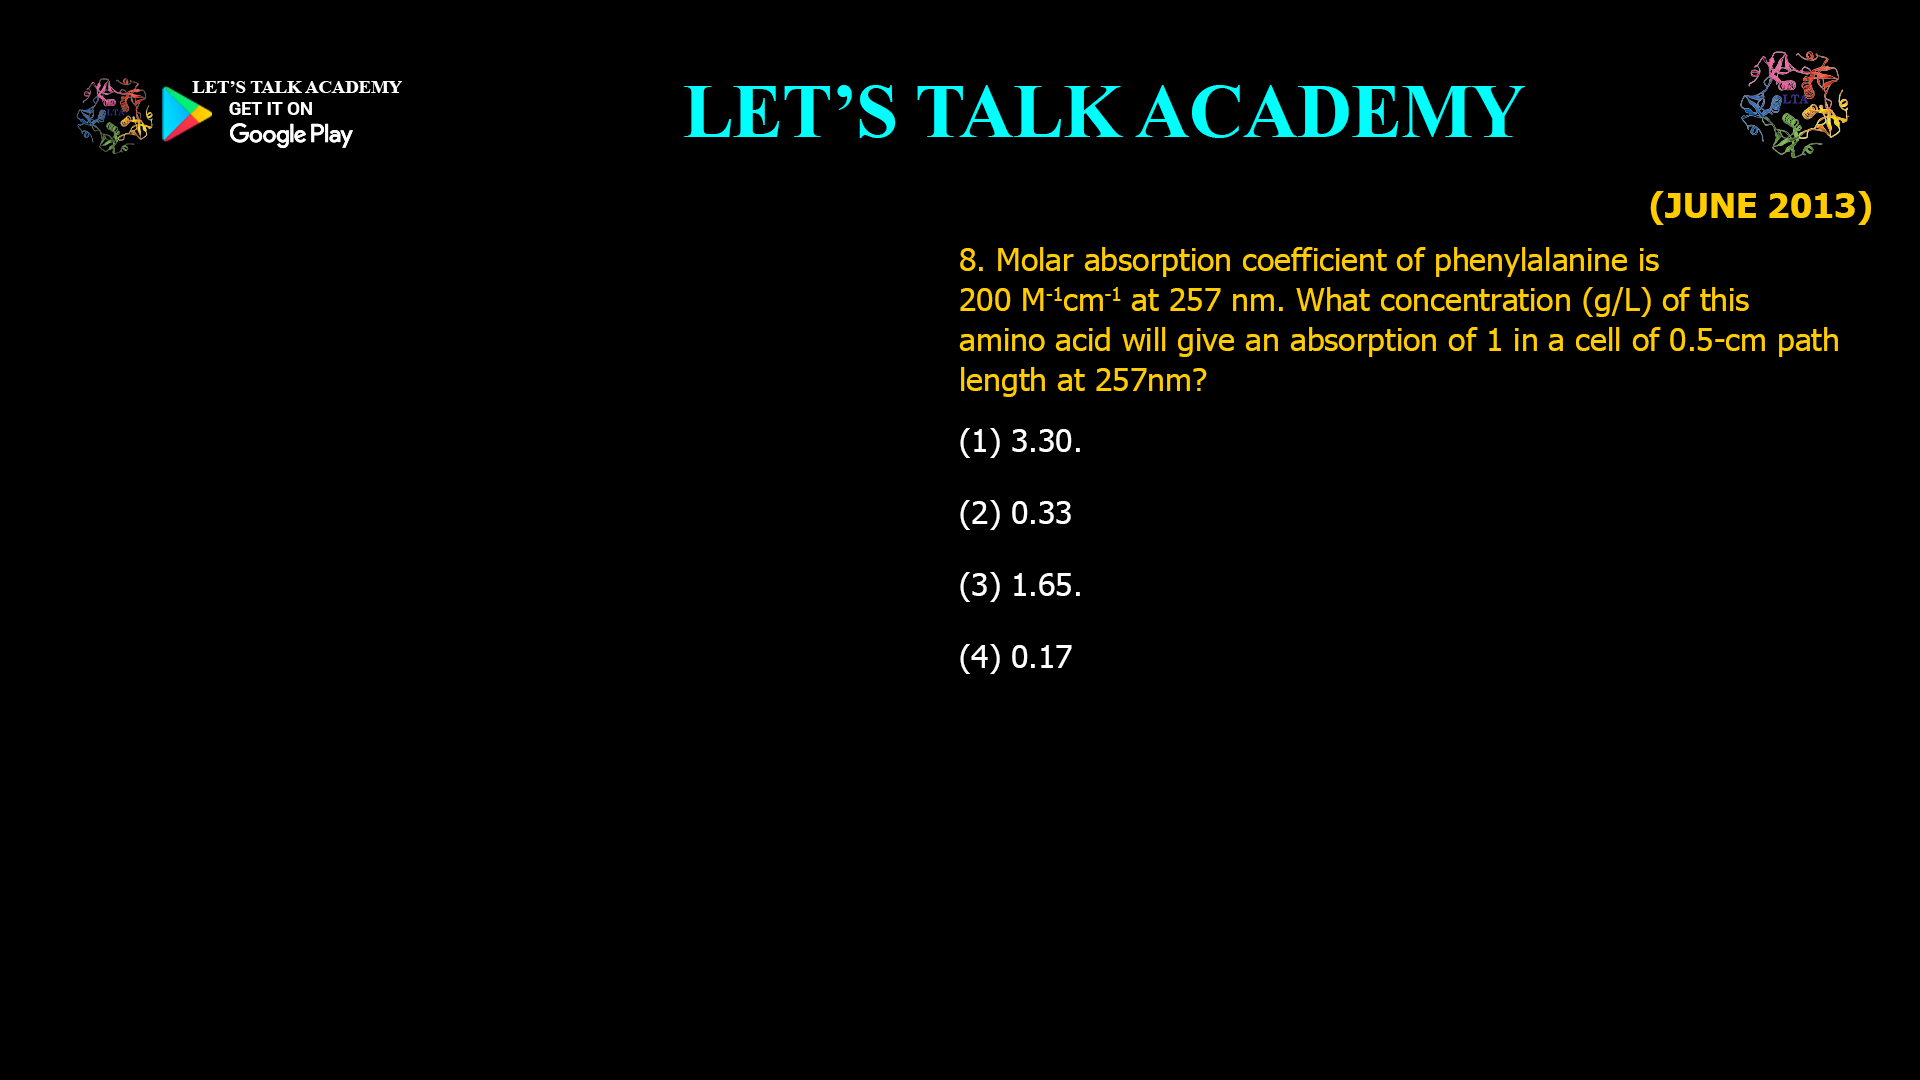
8. Molar absorption coefficient of phenylalanine is 200 M⁻¹ cm⁻¹ at 257 nm. What concentration (g/L) of this amino acid will give an absorption of 1 in a cell of 0.5-cm path length at 257 nm? (1) 3.30 (2) 0.33 (3) 1.65 (4) 0.17

Molar Absorption Coefficient of Phenylalanine

Calculation of Protein Concentration Using the Biuret Assay

Understanding the Units of Molar Extinction Coefficient (ε)

Understanding the Units of Molar Extinction Coefficient (ε)

Calculating Protein Concentration Using UV Absorbance and Molar Extinction Coefficients

Calculating Protein Concentration Using UV Absorbance and Molar Extinction Coefficients

Relationship Between Absorbance and Transmission in Spectrophotometry by Let’s Talk Academy is India’s number one institute for CSIR NET Life Science

Relationship Between Absorbance and Transmission in Spectrophotometry

UV Spectroscopy for most sensitive label-free Protein Quantification by LETS TALK ACADEMY

UV Spectroscopy for most sensitive label-free Protein Quantification

Intrinsic Fluorescence of Protein Is Due to Aromatic amino acids Tryptophan Tyrosine and Phenylalanine

Intrinsic Fluorescence of Protein Is Due to Aromatic amino acids Tryptophan Tyrosine and Phenylalanine

Latest Courses