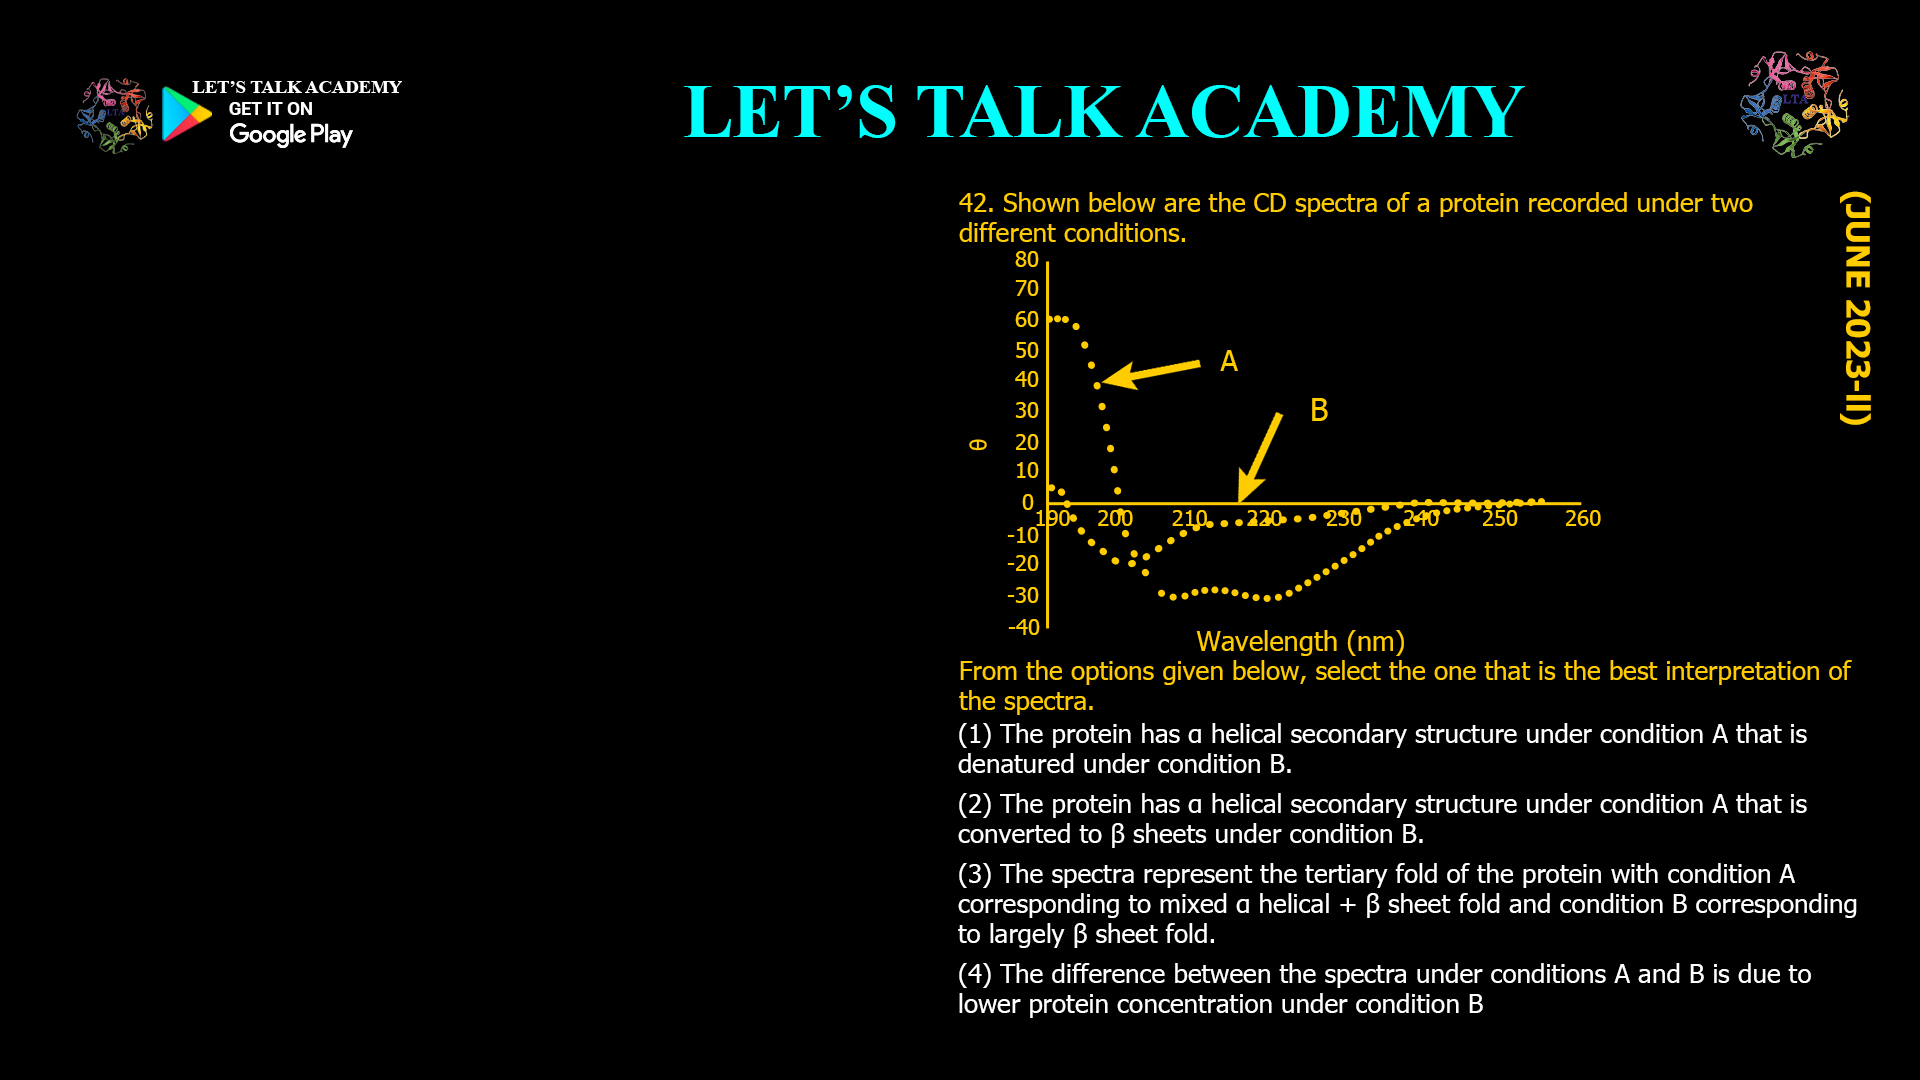
42. Shown below are the CD spectra of a protein recorded under two different conditions.
From the options given below, select the one that is the best interpretation of the spectra.
(A) The protein has a helical secondary structure under condition A that is denatured under condition B.
(B) The protein has a helical secondary structure under condition A that is converted to β sheets under condition B.
(C) The spectra represent the tertiary fold of the protein with condition A corresponding to mixed α helix + β sheet fold and condition B corresponding to largely β sheet fold.
(D) The difference between the spectra under conditions A and B is due to lower protein concentration under condition B.
Interpreting Far-UV Circular Dichroism Spectra of a Protein Under Different Conditions
Correct Answer
Option (1): The protein has a helical secondary structure under condition A that is denatured under condition B.
Explanation
The spectra shown are recorded in the far-UV region (190–260 nm), where Circular Dichroism spectroscopy is primarily used to determine the secondary structure of proteins. In this wavelength range, the observed CD signal originates from electronic transitions of the peptide backbone rather than from amino acid side chains. Consequently, far-UV CD provides direct information about the relative amounts of α-helices, β-sheets, turns, and random coil structures present in a protein.
Under condition A, the spectrum exhibits the characteristic signature of an α-helical protein. It shows a strong positive band near 190 nm together with two pronounced negative minima located approximately at 208 nm and 222 nm. These two negative bands are considered the diagnostic features of an α-helix and arise from the ordered arrangement of peptide bonds within the helical backbone.
Under condition B, these characteristic α-helical minima disappear almost completely, and the spectrum approaches a nearly featureless baseline. The loss of these characteristic bands indicates that the ordered α-helical secondary structure has been disrupted. Since the spectrum does not develop the characteristic β-sheet minimum near 218 nm, the data do not support conversion of the protein into a β-sheet-rich structure. Instead, the observations indicate loss of ordered secondary structure, resulting in a largely unfolded or denatured protein.
The disappearance of the helical CD signal without the appearance of another well-defined secondary structural signature is the typical spectroscopic pattern observed during protein denaturation. Denaturation disrupts the hydrogen bonds that stabilize α-helices, producing a disordered polypeptide chain with greatly reduced ellipticity.
Why Option (1) is Correct
This option correctly explains the observed spectral changes. Condition A displays the two characteristic negative bands at approximately 208 nm and 222 nm that identify an α-helical structure. Under condition B, these bands disappear without being replaced by the characteristic β-sheet spectrum. This demonstrates that the ordered helical structure has been lost because of denaturation rather than conversion into another ordered secondary structure.
Why Option (2) is Incorrect
A β-sheet produces a characteristic far-UV CD spectrum consisting of a negative band near 218 nm and a positive band close to 195 nm. These spectral features are absent under condition B. Therefore, there is no evidence that the α-helical protein has been converted into a β-sheet-rich structure.
Why Option (3) is Incorrect
Far-UV Circular Dichroism does not primarily report the tertiary structure of proteins. Instead, it measures the conformation of the peptide backbone and therefore reflects secondary structural elements. Tertiary structure is investigated using Near-UV Circular Dichroism, fluorescence spectroscopy, nuclear magnetic resonance spectroscopy, or X-ray crystallography. Consequently, this interpretation is based on the wrong structural level.
Why Option (4) is Incorrect
A reduction in protein concentration would decrease the magnitude of the CD signal but would not selectively eliminate the characteristic α-helical minima while preserving the overall spectral shape. The observed spectrum under condition B shows a genuine change in spectral profile rather than a simple reduction in signal intensity. Therefore, the difference arises from structural changes within the protein and not from sample concentration.
Characteristic Far-UV CD Spectra of Common Secondary Structures
Different protein secondary structures generate distinct Circular Dichroism spectra because the peptide backbone adopts different spatial arrangements. An α-helix exhibits a strong positive band near 190 nm together with two negative minima around 208 nm and 222 nm. A β-sheet typically displays a positive band near 195 nm and a negative minimum close to 218 nm. Random coil structures show a strong negative band near 198 nm with little signal at longer wavelengths. Recognition of these characteristic spectral patterns allows rapid identification of the dominant secondary structure in proteins.
Why Denaturation Alters the Far-UV CD Spectrum
The α-helical conformation is stabilized by hydrogen bonds formed between backbone carbonyl oxygen atoms and amide hydrogen atoms separated by four amino acid residues. Denaturing conditions disrupt these hydrogen bonds, allowing the polypeptide chain to adopt a more flexible and disordered conformation. As the ordered arrangement of peptide bonds is lost, the characteristic CD bands associated with the α-helix disappear, producing a spectrum with greatly reduced ellipticity.
Conclusion
The spectrum recorded under condition A displays the characteristic features of an α-helical protein, whereas the spectrum obtained under condition B shows the disappearance of these features without the appearance of a β-sheet signature. This indicates that the protein has undergone denaturation and lost its ordered α-helical secondary structure. Therefore, the correct answer is Option (1).


