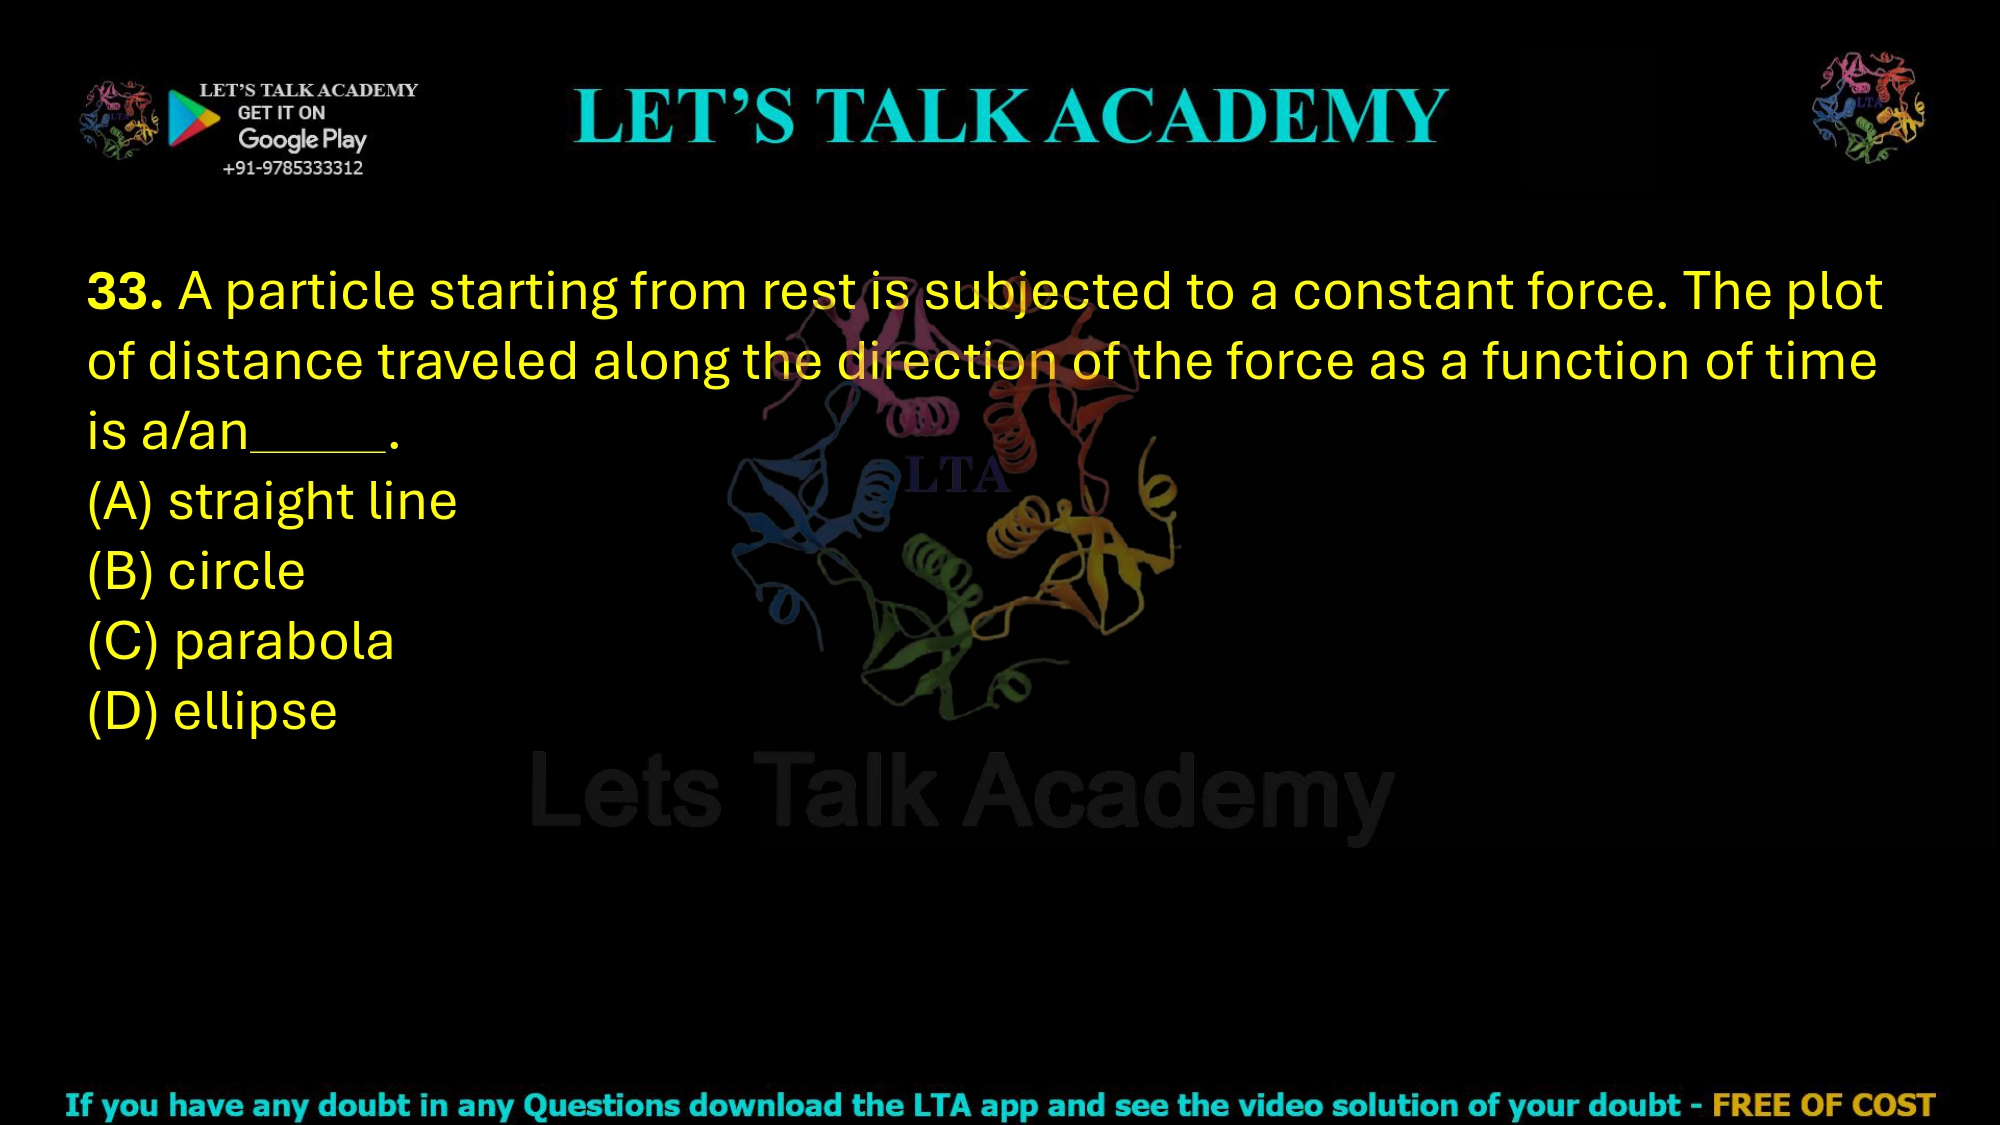
33. A particle starting from rest is subjected to a constant force. The plot of distance traveled along the direction of the force as a function of time is a/an .
(A) straight line
(B) circle
(C) parabola
(D) ellipse
Distance-Time Graph of a Particle Under Constant Force Starting From Rest
Understanding the Motion of the Particle
This question connects Newton’s second law of motion with the equations of uniformly accelerated motion. A particle initially at rest is subjected to a constant force, and we need to identify the shape of the graph obtained when the distance traveled along the direction of the force is plotted as a function of time.
The most important point is that a constant force acting on a particle of constant mass produces constant acceleration. Since the particle starts from rest, its distance traveled increases as the square of time. Therefore, the distance-time relationship is quadratic rather than linear.
Using Newton’s Second Law to Find the Nature of Acceleration
According to Newton’s second law of motion:
F = ma
Rearranging the equation:
a = F/m
The force F is constant, and the mass m of the particle is also constant. Therefore, the acceleration a remains constant throughout the motion.
Thus:
Constant force ⇒ Constant acceleration
The particle is therefore undergoing uniformly accelerated motion along the direction of the applied force.
Applying the Equation of Motion
For motion with constant acceleration, the distance traveled after time t is given by:
s = ut + ½at2
Here, s is the distance traveled, u is the initial velocity, a is the constant acceleration, and t is the time.
The particle starts from rest. Therefore:
u = 0
Substituting u = 0 into the equation of motion:
s = ½at2
Since the acceleration a is constant:
s ∝ t2
This is the mathematical equation of a parabola. Therefore, when distance s is plotted on the vertical axis and time t is plotted on the horizontal axis, the resulting curve is parabolic.
Why Does the Distance-Time Graph Form a Parabola?
A straight-line graph is obtained when one quantity is directly proportional to another. For example, if distance were directly proportional to time, the relationship would be s ∝ t, and the distance-time graph would be a straight line.
In this problem, however, the distance is proportional to the square of time:
s ∝ t2
A relationship of the form y = kx2, where k is a constant, represents a parabola. Here, distance s plays the role of y, time t plays the role of x, and ½a is the constant k. Therefore, the distance-time graph is a parabola.
Mathematical Form of the Distance-Time Relationship
Since the acceleration is produced by the constant force, we can substitute a = F/m into the distance equation:
s = ½(F/m)t2
Therefore:
s = (F/2m)t2
For a given particle and a given constant force, F/2m is a constant. Hence, the equation has the general form:
s = kt2
This quadratic relationship confirms mathematically that the distance-time graph is a parabola passing through the origin.
Shape of the Distance-Time Graph
At t = 0, the particle has traveled zero distance, so the graph begins at the origin. Since the particle starts from rest, the initial slope of the distance-time graph is zero because the slope of a distance-time graph represents speed.
As time passes, the constant force continuously increases the speed of the particle. Therefore, the slope of the distance-time graph becomes progressively steeper. This produces an upward-curving parabolic graph rather than a straight line.
Detailed Analysis of All Options
Option (A): Straight Line
This option is incorrect. A straight-line distance-time graph represents motion with constant speed, where distance is directly proportional to time. In the given situation, the constant force produces constant acceleration, so the speed continuously increases with time. The distance is proportional to t2, not t. Therefore, the graph cannot be a straight line.
Option (B): Circle
This option is incorrect. A circle does not represent the functional relationship between distance and time for a particle undergoing constant acceleration. The equation governing the motion is s = ½at2, which is a quadratic equation. Therefore, a circular graph is not possible.
Option (C): Parabola
This is the correct option. A constant force acting on a particle of constant mass produces constant acceleration. Since the particle starts from rest, the distance traveled is given by s = ½at2. Thus, distance is proportional to the square of time, and the graph of distance against time is a parabola.
Option (D): Ellipse
This option is incorrect. An ellipse is a closed geometrical curve and does not describe the distance-time relationship for uniformly accelerated motion. Since distance increases continuously with time according to a quadratic relationship, the required graph is parabolic rather than elliptical.
Difference Between Distance-Time and Velocity-Time Graphs
For the same particle, the distance-time graph and velocity-time graph have different shapes. Under constant acceleration, velocity changes according to:
v = u + at
Since the particle starts from rest:
v = at
Therefore, velocity is directly proportional to time, so the velocity-time graph is a straight line passing through the origin.
However, distance varies according to:
s = ½at2
Therefore, the distance-time graph is a parabola. This difference arises because velocity increases linearly with time, whereas distance increases quadratically with time.
Physical Interpretation of the Parabolic Graph
The parabolic shape shows that the particle covers increasingly larger distances during equal successive time intervals. This happens because the constant force continuously accelerates the particle, causing its speed to increase with time.
For example, if the time becomes twice as large, the distance becomes four times as large because s ∝ t2. If the time becomes three times as large, the distance becomes nine times as large. This rapid increase in distance produces the characteristic curved shape of a parabola.
Final Answer
Correct Option: (C) Parabola
A constant force acting on a particle of constant mass produces constant acceleration according to F = ma. Since the particle starts from rest, its distance traveled after time t is given by s = ½at2. Therefore, s ∝ t2, which represents a parabola on a distance-time graph.


