
1. Introduction to Growth Kinetics
Growth kinetics is the quantitative study of the rate at which biological cells or microorganisms increase in number, biomass, or cellular components over time.
In microbiology and biotechnology, growth kinetics is particularly important because microorganisms can multiply rapidly under suitable environmental conditions. Understanding their growth allows scientists to predict population behavior, optimize fermentation processes, design bioreactors, and control microbial cultures.
Growth kinetics examines questions such as:
- How rapidly does a population grow?
- How long does one generation take?
- What factors control growth rate?
- How does nutrient concentration affect growth?
- When does growth stop?
- How can growth be measured quantitatively?
- How can growth be modeled mathematically?
The basic relationship is:
Growth rate = Change in biological population or biomass / Time
2. Definition of Growth
Growth refers to an increase in the amount of cellular material or, in the case of microorganisms, commonly an increase in cell number and/or biomass.
Growth should not be confused simply with an increase in cell size.
In a microbial population, growth generally involves:
Nutrient uptake → Biosynthesis → Increase in cellular material → Cell division → Increase in population
3. Growth Kinetics
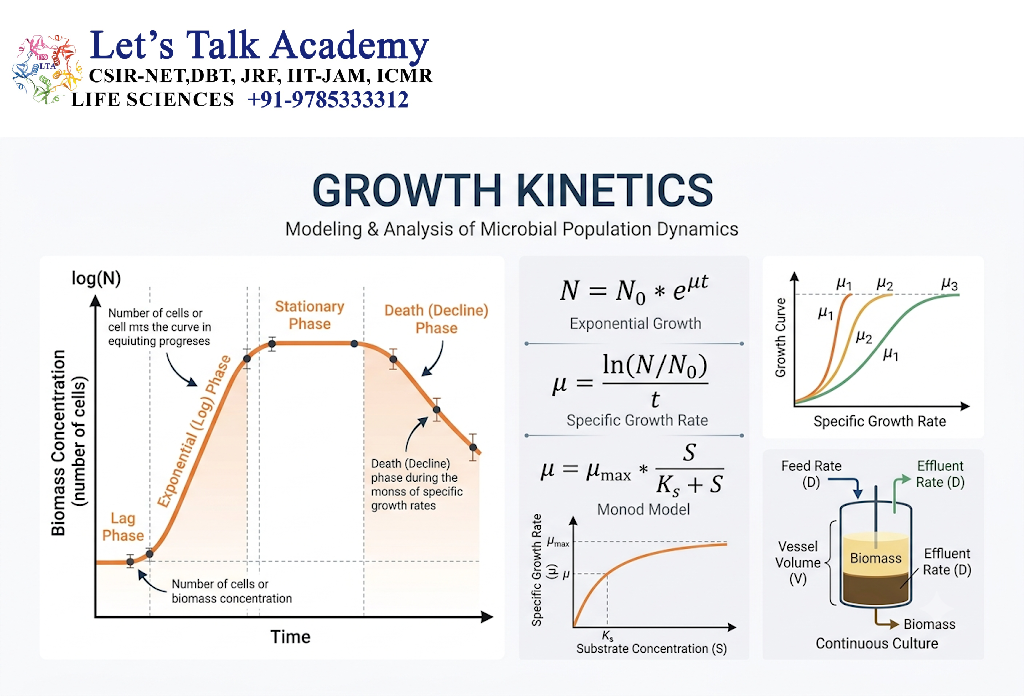
Growth kinetics describes the mathematical relationship between:
- Cell concentration
- Biomass
- Time
- Nutrient concentration
- Growth rate
For microbial cultures, growth can often be approximated using mathematical equations.
A particularly important parameter is the specific growth rate (μ).
4. Microbial Population Growth
Many microorganisms reproduce through binary fission.
A single cell divides into two daughter cells.
The population therefore increases approximately as:
1 → 2 → 4 → 8 → 16 → 32 → 64 → …
This type of population increase is called exponential growth when environmental conditions remain sufficiently favorable.
5. Binary Fission

Binary fission is a common mode of reproduction in bacteria.
The general sequence is:
- DNA replication
- Chromosome segregation
- Cell elongation
- Septum formation
- Separation into daughter cells
Under favorable conditions, each daughter cell can subsequently divide again.
Thus, the number of cells increases approximately by a factor of two per generation.
6. Generation Time
Generation time is the time required for a population to double under specified conditions.
It is commonly represented by g.
For example, if a culture increases from 1 million cells to 2 million cells in 30 minutes, its generation time under those conditions is approximately 30 minutes.
Generation time depends on:
- Microorganism
- Temperature
- Nutrient availability
- pH
- Oxygen availability
- Osmotic conditions
- Waste accumulation
- Culture conditions
7. Doubling Time
Doubling time is closely related to generation time.
For a population undergoing ideal binary division:
Doubling time ≈ Generation time
In practical systems, however, the terminology may be used differently depending on whether one is discussing cell number, biomass, or a particular population model.
8. Exponential Growth

During exponential growth, the rate of increase in cell number is proportional to the number of cells already present.
The mathematical relationship can be written as:
Nₜ = N₀ × 2ⁿ
Where:
- Nₜ = population at time t
- N₀ = initial population
- n = number of generations
The number of generations can be calculated as:
n = log₂(Nₜ/N₀)
or:
n = [log₁₀Nₜ − log₁₀N₀] / log₁₀2
Since:
log₁₀2 ≈ 0.301
the equation can also be expressed as:
n ≈ (log₁₀Nₜ − log₁₀N₀) / 0.301
9. Specific Growth Rate
The specific growth rate (μ) describes the rate of increase in biomass or cell concentration relative to the amount already present.
During exponential growth:
μ = (1/X)(dX/dt)
Where:
- μ = specific growth rate
- X = biomass or cell concentration
- dX/dt = change in biomass or cell concentration with time
The unit of μ is commonly:
time⁻¹
For example:
h⁻¹
10. Exponential Growth Equation
During exponential growth:
dX/dt = μX
Integrating this equation gives:
Xₜ = X₀eᵘᵗ
Where:
- Xₜ = biomass at time t
- X₀ = initial biomass
- μ = specific growth rate
- t = time
Taking natural logarithms:
ln(Xₜ/X₀) = μt
Therefore:
μ = ln(Xₜ/X₀)/t
11. Relationship Between Specific Growth Rate and Generation Time
For a population that doubles during one generation:
Xₜ = 2X₀
Therefore:
μg = ln 2
So:
μ = ln2/g
Therefore:
g = ln2/μ
Since:
ln2 ≈ 0.693
we can write:
g ≈ 0.693/μ
This relationship is one of the most important equations in growth kinetics.
12. Growth Rate and Generation Number
If the culture undergoes n generations:
Xₜ = X₀ × 2ⁿ
Taking logarithms:
n = log₂(Xₜ/X₀)
The total growth time can then be related to generation time:
t = ng
Therefore:
n = t/g
Combining these relationships gives the exponential growth equation.
13. Growth Curve
When microbial population size is plotted against time, a characteristic growth curve is obtained.
A typical batch culture contains four classical phases:
- Lag phase
- Exponential or log phase
- Stationary phase
- Death or decline phase
The overall pattern can be represented as:
Lag → Exponential → Stationary → Death
14. Lag Phase

The lag phase occurs immediately after microorganisms are introduced into a new environment.
There may be little or no increase in cell number during this phase, but cells are metabolically active.
During lag phase, cells may:
- Adapt to the new environment
- Synthesize enzymes
- Repair cellular damage
- Produce RNA and proteins
- Adjust metabolic pathways
- Prepare for rapid division
15. Factors Affecting Lag Phase
The duration of lag phase depends on:
- Age of inoculum
- Nutritional differences
- Temperature
- pH
- Oxygen availability
- Physiological condition of cells
- Size of inoculum
- Previous growth conditions
A healthy inoculum transferred into a similar environment generally has a shorter lag phase.
16. Exponential or Log Phase
The exponential phase is characterized by rapid population increase.
During this phase:
- Cells divide at approximately constant maximal rate under the prevailing conditions.
- Biomass increases exponentially.
- Metabolic activity is generally high.
- Cells are often physiologically relatively uniform.
This phase is especially useful for studying microbial physiology and growth kinetics.
17. Mathematical Description of Log Phase
During exponential growth:
dX/dt = μX
and:
X = X₀eᵘᵗ
The logarithm of biomass therefore increases linearly with time.
A plot of:
ln X vs time
should give a straight line during ideal exponential growth.
The slope represents:
μ
18. Maximum Specific Growth Rate
Under a given set of favorable conditions, there is a maximum specific growth rate called μmax.
It depends on:
- Organism
- Temperature
- pH
- Nutrient conditions
- Oxygen availability
- Other environmental factors
When the growth-limiting substrate is sufficiently abundant, μ may approach μmax.
19. Stationary Phase

Eventually, exponential growth slows and the culture enters the stationary phase.
In a closed batch culture, this can occur because:
- Nutrients become limiting
- Oxygen becomes limiting
- Toxic metabolites accumulate
- pH changes
- Space becomes limiting
- Other environmental stresses increase
During stationary phase:
Rate of cell formation ≈ Rate of cell loss
Therefore, the total viable population may remain approximately constant for a period.
20. Physiological Changes in Stationary Phase
Cells may undergo major physiological changes during stationary phase.
These can include:
- Reduced growth
- Altered metabolism
- Stress-response activation
- Production of survival proteins
- Changes in cell morphology
- Increased resistance to certain stresses
Some microorganisms produce specialized structures or metabolites during this stage.
21. Death or Decline Phase
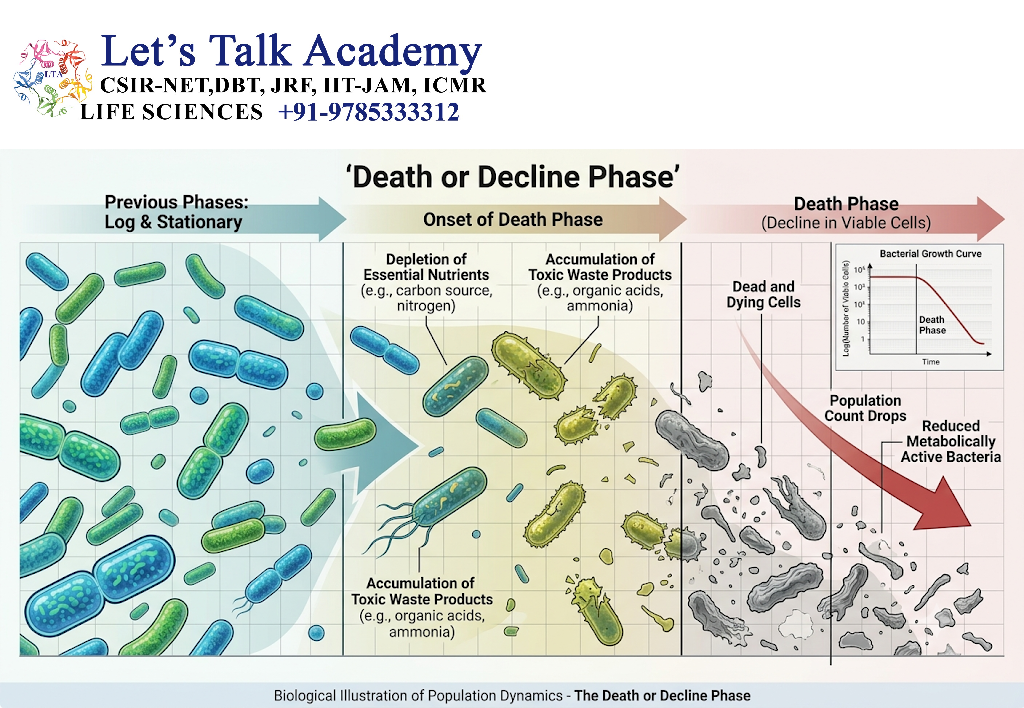
When environmental conditions become increasingly unfavorable, the number of viable cells may decrease.
This is called the death or decline phase.
Possible causes include:
- Severe nutrient depletion
- Accumulation of toxic products
- Extreme pH
- Oxygen limitation
- Loss of essential metabolic activity
The decline may not always follow a simple exponential pattern.
22. Complete Microbial Growth Curve
A simplified growth curve is:
Inoculation
↓
Lag phase
↓
Exponential phase
↓
Stationary phase
↓
Death/decline phase
Each phase reflects a different physiological state of the population.
23. Factors Affecting Growth Kinetics
Growth rate is affected by numerous environmental and nutritional factors.
Important factors include:
- Temperature
- pH
- Nutrient concentration
- Oxygen
- Water availability
- Osmotic pressure
- Waste accumulation
- Pressure
- Radiation
- Inhibitory compounds
24. Effect of Temperature
Microorganisms have characteristic temperature ranges for growth.
They can broadly be classified as:
- Psychrophiles
- Psychrotrophs
- Mesophiles
- Thermophiles
- Hyperthermophiles
Temperature affects:
- Enzyme activity
- Membrane properties
- Protein stability
- Metabolic reactions
- Growth rate
25. Effect of pH
pH influences:
- Enzyme activity
- Membrane transport
- Protein stability
- Nutrient availability
Microorganisms can be broadly classified according to their preferred pH range.
Examples include:
- Acidophiles
- Neutrophiles
- Alkaliphiles
26. Effect of Nutrient Concentration
Growth requires nutrients such as:
- Carbon
- Nitrogen
- Phosphorus
- Sulfur
- Minerals
- Trace elements
- Growth factors when required
At low concentrations, the availability of a particular nutrient can limit growth.
27. Limiting Nutrient
A limiting nutrient is a nutrient whose availability restricts the growth rate under particular conditions.
For example, if carbon is insufficient while all other nutrients are abundant, carbon may become the growth-limiting substrate.
The limiting nutrient can determine:
- Maximum biomass
- Growth rate
- Metabolic activity
28. Substrate-Limited Growth
When growth depends on the concentration of a limiting substrate, the relationship between substrate concentration and growth rate can be described mathematically.
One of the most widely used models is the Monod equation.
29. Monod Equation
The Monod equation describes the relationship between specific growth rate and limiting substrate concentration:
μ = μmax S / (Kₛ + S)
Where:
- μ = specific growth rate
- μmax = maximum specific growth rate
- S = limiting substrate concentration
- Kₛ = half-saturation constant
30. Meaning of the Monod Constant
The Kₛ value is the substrate concentration at which:
μ = μmax/2
A lower Kₛ generally indicates that the organism can achieve a relatively high growth rate at a lower substrate concentration.
However, Kₛ is a model parameter and should not automatically be interpreted as a simple universal measure of substrate affinity.
31. Interpretation of the Monod Equation
When:
S << Kₛ
growth rate is strongly dependent on substrate concentration.
When:
S >> Kₛ
growth rate approaches μmax.
Therefore:
Low substrate → Growth limited
High substrate → Growth approaches maximum
32. Monod Growth Curve
The relationship can be conceptually represented as:
Substrate concentration increases
↓
Specific growth rate increases
↓
Growth rate approaches μmax
The curve is saturating rather than indefinitely linear.
33. Batch Culture
A batch culture is a closed cultivation system in which:
- Nutrients are initially supplied
- No continuous fresh medium is added
- Culture develops through successive growth phases
Batch culture is commonly used for:
- Laboratory experiments
- Microbial physiology
- Fermentation studies
- Growth-curve analysis
34. Continuous Culture
In a continuous culture system:
- Fresh nutrient medium continuously enters the vessel.
- Culture fluid continuously leaves.
- Environmental conditions can be maintained within a controlled range.
The system can support a relatively steady physiological state.
35. Chemostat

A chemostat is a type of continuous culture system in which growth is controlled by a limiting nutrient.
Fresh medium enters at a defined flow rate, and an equivalent volume of culture leaves.
At steady state:
Growth rate ≈ Dilution rate
Thus:
μ = D
where D is the dilution rate.
36. Dilution Rate
The dilution rate is defined as:
D = F/V
Where:
- D = dilution rate
- F = flow rate of fresh medium
- V = culture volume
The unit is commonly:
time⁻¹
For example:
h⁻¹
37. Steady State in a Chemostat
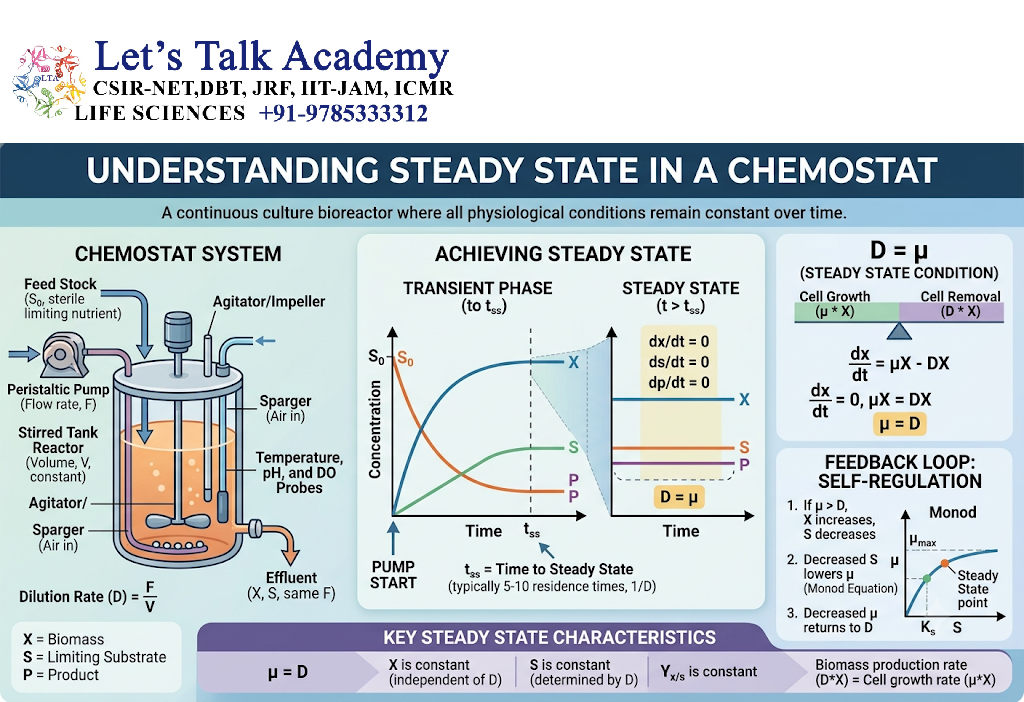
At steady state:
Cell concentration ≈ Constant
Substrate concentration ≈ Constant
Growth rate ≈ Dilution rate
Therefore:
μ = D
provided the culture is operating within the appropriate steady-state regime.
38. Washout
If the dilution rate becomes too high, microorganisms may be removed from the reactor faster than they can reproduce.
This condition is called washout.
Conceptually:
High dilution rate → Insufficient time for population replacement → Cell concentration falls → Washout
39. Turbidostat
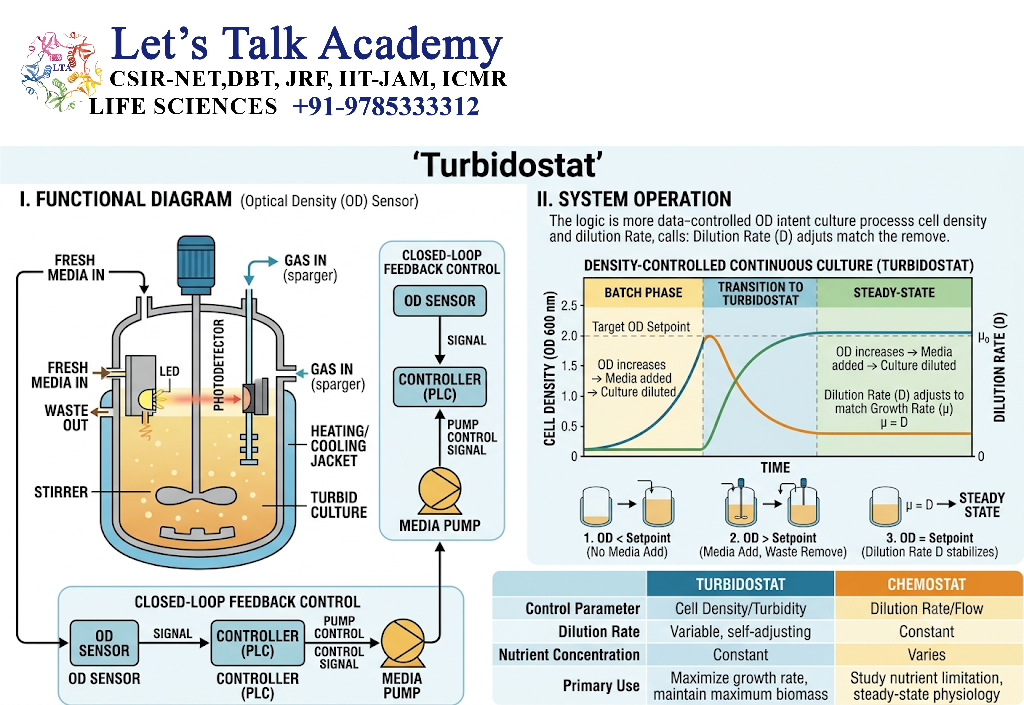
A turbidostat is another type of continuous culture system.
Instead of maintaining a fixed dilution rate, it uses optical density or turbidity to control the flow of fresh medium.
The objective is to maintain culture turbidity near a selected value.
40. Batch Culture vs Continuous Culture
| Feature | Batch Culture | Continuous Culture |
|---|---|---|
| Fresh medium | Not continuously supplied | Continuously supplied |
| Culture volume | Generally changes little before sampling | Approximately constant |
| Growth phases | Clearly observed | Can maintain steady state |
| Nutrients | Progressively depleted | Continuously replenished |
| Waste | Accumulates | Continuously removed |
| Main applications | Growth studies, batch fermentation | Controlled physiological studies and production |
41. Measurement of Microbial Growth
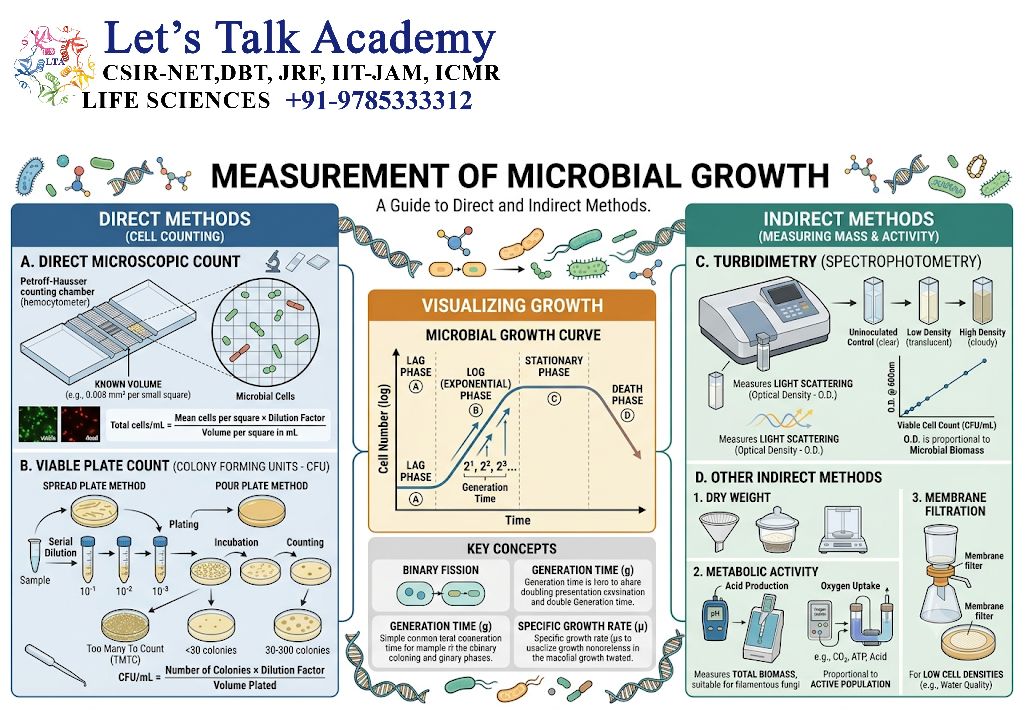
Growth can be measured using direct or indirect methods.
Important methods include:
- Direct cell counting
- Viable cell counting
- Turbidity
- Biomass measurement
- Dry weight
- Optical density
- Metabolic activity
42. Direct Microscopic Count
Cells can be counted directly using a microscope and counting chamber.
Advantages:
- Rapid
- Simple
- Measures total cells
Limitation:
It generally cannot distinguish living cells from dead cells unless additional viability methods are used.
43. Viable Plate Count
The viable plate count estimates the number of living microorganisms capable of forming colonies under the selected culture conditions.
Results are commonly expressed as:
CFU/mL
where CFU means colony-forming units.
A dilution series is generally prepared before plating when cell concentration is high.
44. Turbidity Measurement
As cell concentration increases, a microbial suspension becomes more turbid because cells scatter light.
Turbidity can be measured using:
- Spectrophotometer
- Colorimeter
- Optical-density instruments
A common measurement is:
OD₆₀₀
which refers to optical density measured at a wavelength of approximately 600 nm.
45. Relationship Between Optical Density and Cell Concentration
Within an appropriate range, optical density may correlate with biomass or cell concentration.
However, the relationship is not universally linear across all concentrations.
At high cell densities, light scattering can become nonlinear.
Therefore, calibration against known biomass or cell counts is often required.
46. Dry Weight Method
Microbial biomass can be collected, dried, and weighed.
The result provides an estimate of total biomass.
This method is useful when:
- Large amounts of biomass are available
- Quantitative biomass measurement is required
However, it is relatively time-consuming.
47. Biomass Concentration
Biomass can be represented as:
X = mass of cellular material / volume of culture
Common units include:
g/L
Biomass concentration is an important parameter in bioprocess engineering.
48. Specific Growth Rate and Biomass
During exponential growth:
dX/dt = μX
Therefore, the rate of biomass formation increases as biomass increases.
This explains why exponential growth becomes progressively faster in absolute terms.
49. Growth Yield
Growth yield describes the amount of biomass produced from a given quantity of substrate.
A commonly used parameter is:
Yₓ/ₛ = ΔX / ΔS
Where:
- Yₓ/ₛ = biomass yield on substrate
- ΔX = biomass produced
- ΔS = substrate consumed
Typical units include:
g biomass/g substrate
50. Substrate Consumption
Microorganisms consume substrates for:
- Energy production
- Biosynthesis
- Maintenance
- Cellular repair
The relationship between substrate consumption and growth depends on the organism and environmental conditions.
51. Maintenance Energy
Not all substrate consumed by a microorganism is converted into new biomass.
Some energy is required for maintenance processes such as:
- Ion gradients
- Repair
- Protein turnover
- Motility
- Cellular homeostasis
Therefore:
Substrate consumption = Growth requirement + Maintenance requirement
52. Pirt Relationship
The relationship between substrate consumption and growth can be represented by the Pirt model:
qₛ = μ/Yₓ/ₛ + mₛ
Where:
- qₛ = specific substrate uptake rate
- μ = specific growth rate
- Yₓ/ₛ = growth yield
- mₛ = maintenance coefficient
This model separates substrate consumption associated with biomass formation from substrate consumption required for maintenance.
53. Growth-Associated and Non-Growth-Associated Products
Microbial metabolism can produce different types of products.
Growth-associated products
Their formation is closely linked to active biomass growth.
Non-growth-associated products
Their formation may continue even when growth has slowed or stopped.
Secondary metabolites are often associated with stationary-phase physiology.
54. Primary and Secondary Metabolism
Primary metabolism is directly associated with:
- Energy generation
- Biosynthesis
- Growth
- Cellular maintenance
Secondary metabolism produces compounds that are not always essential for immediate growth.
Examples include certain:
- Antibiotics
- Pigments
- Toxins
- Signaling molecules
55. Specific Growth Rate During Different Phases
| Phase | Specific growth rate |
|---|---|
| Lag | Low or variable |
| Exponential | Relatively constant and high |
| Stationary | Approximately zero net growth |
| Death | Net viable population decreases |
These values are conceptual and depend on the measurement method and biological system.
56. Mathematical Modeling of Growth
Mathematical models allow scientists to describe and predict population behavior.
Important models include:
- Exponential growth model
- Monod model
- Logistic growth model
- Gompertz-type models
- Contois model
- Models incorporating substrate inhibition
57. Logistic Growth Model
When resources become limited, population growth may deviate from exponential growth.
A classical logistic model is:
dX/dt = μmax X(1 − X/K)
Where:
- X = population or biomass
- K = carrying capacity
Growth slows as the population approaches the environmental carrying capacity.
58. Carrying Capacity
Carrying capacity is the maximum population or biomass that a particular environment can sustain under specified conditions.
As the population approaches carrying capacity:
Competition increases → Net growth decreases
The logistic model therefore produces an S-shaped growth curve.
59. Exponential vs Logistic Growth
| Feature | Exponential | Logistic |
|---|---|---|
| Resources | Assumed sufficiently favorable | Become limiting |
| Growth rate | Continuously proportional to population | Decreases near carrying capacity |
| Curve | J-shaped | S-shaped |
| Environmental limit | Not explicitly included | Included as carrying capacity |
60. Substrate Inhibition
Sometimes increasing substrate concentration does not continuously increase growth.
At sufficiently high concentrations, the substrate itself may become inhibitory.
A conceptual relationship is:
Low substrate → Growth increases
Moderate substrate → Growth approaches optimum
Excess substrate → Growth decreases
This phenomenon is known as substrate inhibition.
61. Effect of Oxygen on Growth
Oxygen availability can strongly affect growth kinetics.
Microorganisms may be:
- Obligate aerobes
- Facultative anaerobes
- Obligate anaerobes
- Aerotolerant organisms
- Microaerophiles
Oxygen influences:
- Energy generation
- Redox balance
- Metabolic pathways
- Growth rate
62. Effect of Water Activity
Water availability affects microbial growth.
Microorganisms generally require sufficient available water for:
- Enzyme activity
- Transport
- Metabolism
- Macromolecular synthesis
Reduced water activity can inhibit growth.
63. Effect of Osmotic Pressure
High concentrations of salts or sugars can create osmotic stress.
Cells may lose water and experience impaired growth.
Some microorganisms, such as halophiles, are specifically adapted to high-salt environments.
64. Growth Kinetics in Biotechnology
Growth kinetics is fundamental to industrial biotechnology.
It is used to optimize:
- Fermentation
- Antibiotic production
- Enzyme production
- Organic-acid production
- Biofuel production
- Recombinant protein production
- Wastewater treatment
65. Growth Kinetics in Bioreactors
In a bioreactor, growth kinetics helps determine:
- Feeding rate
- Dilution rate
- Biomass concentration
- Oxygen demand
- Nutrient requirements
- Product formation
- Harvest time
Therefore, kinetic parameters are essential for process design and optimization.
66. Growth Kinetics and Fermentation
During fermentation, microorganisms convert substrates into:
- Biomass
- Metabolites
- Desired products
Understanding growth kinetics helps determine when the culture should be harvested for maximum product yield.
67. Growth Kinetics and Environmental Microbiology
Growth kinetics is also important for studying microbial populations in natural environments.
Applications include:
- Wastewater treatment
- Soil microbiology
- Bioremediation
- Aquatic ecosystems
- Nutrient cycling
- Decomposition
68. Growth Kinetics and Antibiotic Studies
Antimicrobial compounds can alter microbial growth kinetics.
They may:
- Increase lag time
- Reduce growth rate
- Stop growth
- Reduce viable cell numbers
Growth curves can therefore help characterize antimicrobial effects.
69. Growth Kinetics and Population Dynamics
Microbial populations do not grow independently of their environment.
Population dynamics depends on:
Growth rate + Resource availability + Environmental conditions + Competition + Cell death
This makes growth kinetics an important component of ecological modeling.
70. Important Growth-Kinetic Parameters
| Parameter | Symbol | Meaning |
|---|---|---|
| Biomass | X | Amount of cellular material |
| Cell concentration | N | Number of cells per volume |
| Specific growth rate | μ | Relative rate of biomass increase |
| Maximum specific growth rate | μmax | Maximum growth rate under given conditions |
| Generation time | g | Time required for doubling |
| Substrate concentration | S | Concentration of limiting nutrient |
| Half-saturation constant | Kₛ | S at μ = μmax/2 in Monod model |
| Dilution rate | D | Medium flow rate relative to culture volume |
| Yield coefficient | Yₓ/ₛ | Biomass produced per substrate consumed |
| Maintenance coefficient | mₛ | Substrate use associated with maintenance |


