
Conformation of Proteins: Ramachandran Plot
1. Introduction to Protein Conformation
Proteins are dynamic three-dimensional molecules whose biological functions depend strongly on their structure and conformational behavior. A protein is not simply a linear sequence of amino acids. After synthesis, the polypeptide chain undergoes folding and adopts specific three-dimensional arrangements that allow it to perform functions such as catalysis, molecular recognition, transport, structural support, and signal transduction.
The conformation of a protein refers to the specific three-dimensional arrangement of its atoms that can be achieved without breaking covalent bonds. Because a polypeptide contains many bonds, it might initially appear that an enormous number of conformations are possible. In reality, the conformational freedom of a protein backbone is strongly restricted by the geometry of the peptide bond, steric interactions between atoms, hydrogen bonding, electrostatic interactions, side-chain properties, and the surrounding environment.
A useful way to understand protein backbone conformation is through dihedral angles, also called torsion angles. The two most important variable backbone dihedral angles are the phi (φ) and psi (ψ) angles. The possible combinations of these two angles can be represented graphically using the Ramachandran plot.
The Ramachandran plot is therefore a two-dimensional map of protein backbone conformations. It shows which combinations of φ and ψ angles are sterically and energetically favorable and which combinations are unfavorable. It also provides a direct structural connection between the geometry of individual amino acid residues and the formation of larger structural elements such as α-helices, β-sheets, and turns.
The concept was developed by G. N. Ramachandran and colleagues, whose analysis demonstrated that only a limited portion of the theoretically possible conformational space is accessible to polypeptide chains. This was a major contribution to structural biology because it provided a simple way of visualizing the conformational restrictions imposed by atomic geometry.
2. Organization of the Protein Backbone
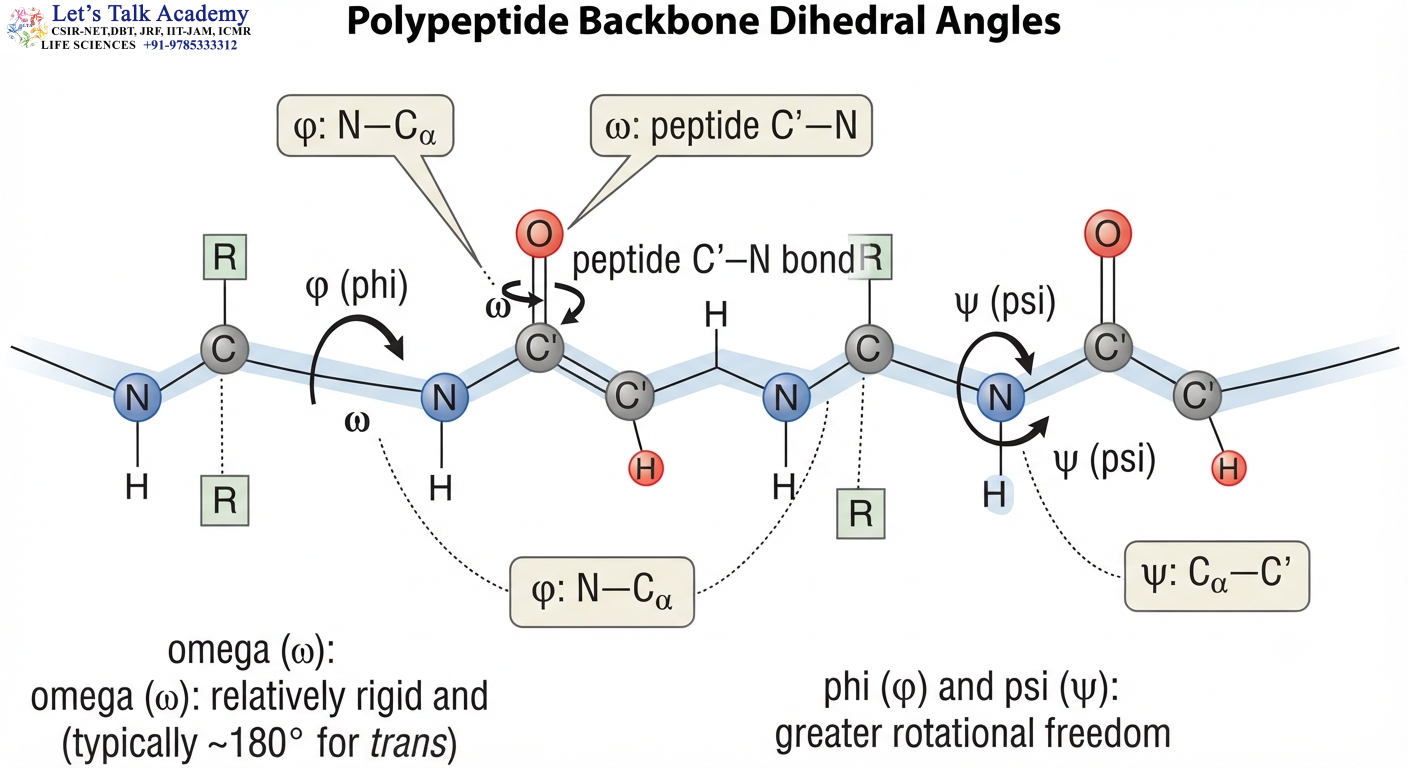
The backbone of a typical polypeptide can be represented by the repeating sequence:
–N–Cα–C(=O)–N–Cα–C(=O)–
The three principal backbone atoms associated with each amino acid residue are the backbone nitrogen (N), the alpha carbon (Cα), and the carbonyl carbon (C).
The Cα atom is particularly important because it connects the backbone to the side chain of the amino acid. In a conventional amino acid residue, the Cα atom is attached to four groups: the amino group, the carbonyl group, a hydrogen atom, and the side chain.
The backbone contains three successive bonds around which rotation might initially seem possible:
N–Cα
Cα–C
C–N
However, these bonds do not have equal rotational freedom.
The C–N peptide bond has substantial partial double-bond character because of resonance between the carbonyl group and the nitrogen atom. Consequently, the peptide bond is relatively rigid and approximately planar. Rotation around this bond is therefore highly restricted.
The two bonds on either side of the Cα atom, namely N–Cα and Cα–C, have much greater rotational freedom. Their rotations are described by the φ and ψ angles, respectively.
This difference in flexibility is the fundamental structural basis of the Ramachandran plot.
3. The Peptide Bond and Its Planarity
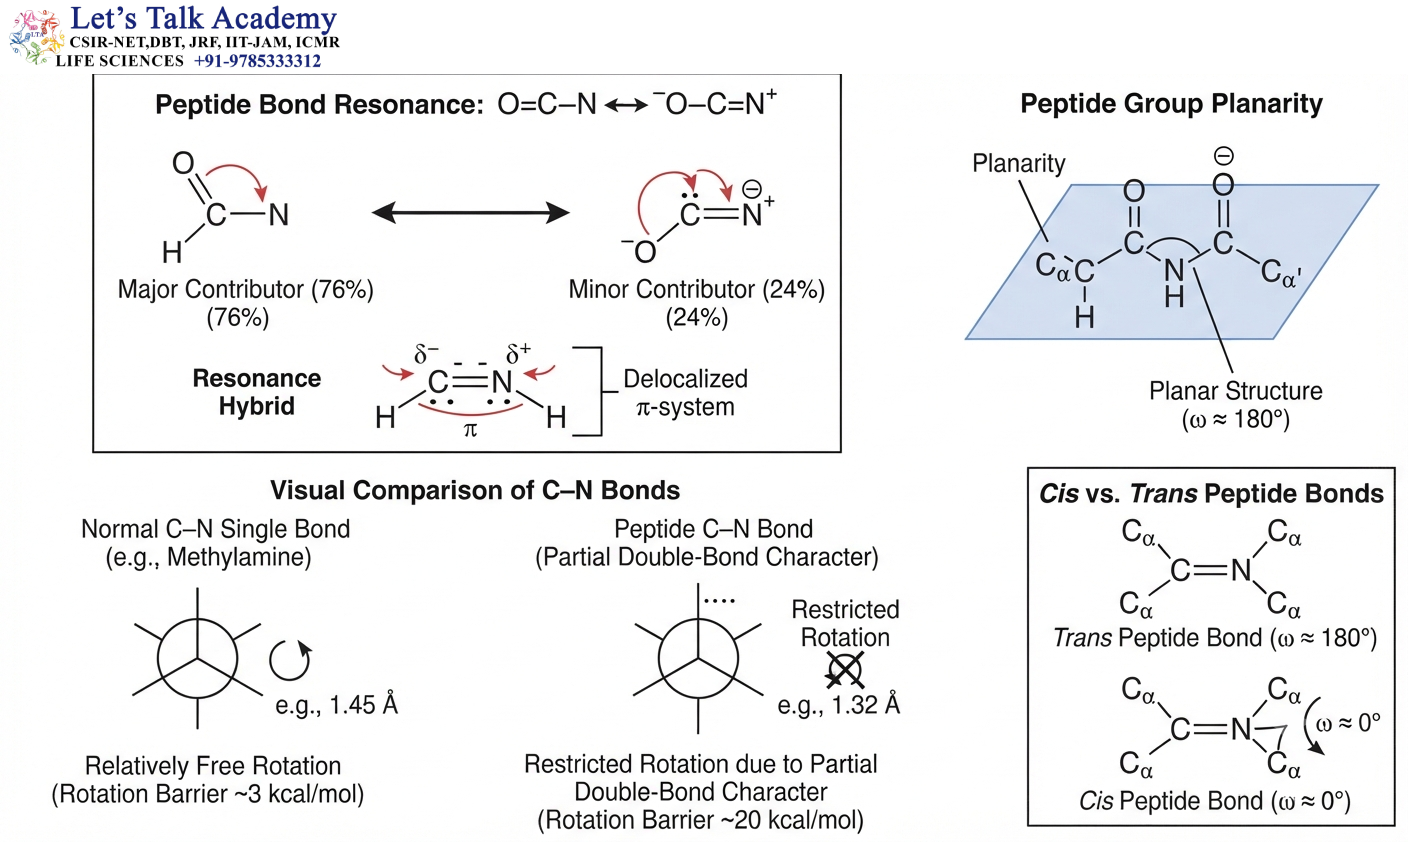
The peptide bond is formed when the carboxyl group of one amino acid reacts with the amino group of another amino acid with the elimination of water.
A simplified representation is:
–C(=O)–OH + H–N– → –C(=O)–N– + H₂O
The resulting peptide bond has resonance character:
O=C–N ↔ O⁻–C=N⁺
Because of this resonance, the C–N bond is shorter and more rigid than an ordinary C–N single bond.
The atoms involved in the peptide unit are approximately coplanar. This means that the peptide group behaves almost like a rigid structural unit rather than a freely rotating single bond.
The dihedral angle associated with the peptide bond is called omega (ω).
For the common trans peptide bond:
ω ≈ 180°
For a cis peptide bond:
ω ≈ 0°
Most peptide bonds in proteins are in the trans configuration. Cis peptide bonds are much less common, although they are particularly significant when the residue following the peptide bond is proline.
Because ω is usually close to 180°, the principal conformational variables of the polypeptide backbone are φ and ψ.
4. Phi (φ) Dihedral Angle
The phi (φ) angle describes rotation around the N–Cα bond.
For residue i, it can be represented as:
φ = C(i−1)–N(i)–Cα(i)–C(i)
Changing the φ angle alters the orientation of the peptide unit preceding the Cα atom relative to the rest of the backbone.
Although the N–Cα bond can rotate, the rotation is not unrestricted. As the φ angle changes, atoms in the backbone and side chain move closer to or farther from one another. Certain angular combinations therefore produce unfavorable steric contacts.
The accessible range of φ is consequently restricted by the three-dimensional arrangement of the surrounding atoms.
5. Psi (ψ) Dihedral Angle
The psi (ψ) angle describes rotation around the Cα–C(=O) bond.
For residue i, it can be represented as:
ψ = N(i)–Cα(i)–C(i)–N(i+1)
Changing ψ changes the orientation of the peptide unit following the Cα atom.
Like φ, the ψ angle is influenced by steric interactions and by the local structural environment. Some combinations of φ and ψ allow the backbone atoms to occupy favorable positions, whereas others cause unfavorable interactions.
The combination of φ and ψ therefore provides a convenient description of the local backbone conformation.
6. Omega (ω) Dihedral Angle
The omega (ω) angle describes rotation around the peptide C–N bond.
It can be represented as:
ω = Cα(i)–C(i)–N(i+1)–Cα(i+1)
Because of the partial double-bond character of the peptide C–N bond, ω is much more restricted than φ and ψ.
For the common trans peptide configuration:
ω ≈ 180°
For the less common cis configuration:
ω ≈ 0°
This is why the conventional Ramachandran plot does not normally use ω as one of its two axes. Instead, it plots the two principal variable backbone angles:
φ and ψ
7. What Is a Ramachandran Plot?

A Ramachandran plot is a two-dimensional graphical representation of the φ and ψ dihedral angles of amino acid residues in a protein.
The conventional arrangement is:
X-axis → φ
Y-axis → ψ
Both axes generally cover:
−180° to +180°
Each residue in a protein can therefore be represented as one point on the graph.
For example, if a residue has:
φ = −60°
and
ψ = −45°
the residue is plotted at:
(−60°, −45°)
This location is close to the characteristic region associated with a right-handed α-helix.
The plot does not show the complete three-dimensional structure of a protein. Instead, it describes the local conformational state of individual backbone residues.
When the φ and ψ values of all residues are plotted together, characteristic clusters appear. These clusters correspond to the conformations most commonly adopted by protein backbones.
8. Why Are Some Regions Allowed and Others Forbidden?

The most important physical basis of the Ramachandran plot is steric hindrance.
Atoms occupy space. They cannot overlap freely, and bringing two nonbonded atoms excessively close to one another creates strong repulsive interactions.
When a particular combination of φ and ψ angles causes atoms to approach too closely, the conformation becomes energetically unfavorable.
Therefore, the theoretical square of possible φ and ψ values from −180° to +180° does not represent an equally accessible conformational space.
Instead, it contains:
Favored conformations
Allowed conformations
Disallowed conformations
The favored regions contain conformations that are frequently observed and energetically favorable. Allowed regions contain conformations that are physically possible but less frequently populated. Disallowed regions contain conformations that are strongly unfavorable because of steric or other energetic constraints.
The modern interpretation is more comprehensive than the original purely steric model. Hydrogen bonding, electrostatic interactions, backbone dipoles, side-chain interactions, solvent effects, and the local structural environment also influence which conformations are actually observed in proteins.
9. General Arrangement of the Ramachandran Plot
The conventional Ramachandran plot is divided into four broad quadrants based on the signs of φ and ψ.
The most important regions for ordinary amino acid residues are the upper-left, lower-left, and, to a smaller extent, upper-right regions.
The upper-left region is associated mainly with extended conformations such as β-strands.
The lower-left region contains the major population corresponding to right-handed α-helices.
The upper-right region corresponds to left-handed helical conformations and is particularly accessible to glycine.
The lower-right region is generally much less populated for most standard amino acid residues.
The exact boundaries of these regions are not universal because modern Ramachandran analyses use statistical distributions derived from experimentally determined structures.
10. Favored, Allowed, and Disallowed Regions
10.1 Favored Regions
Favored regions contain the most frequently observed φ–ψ combinations.
These conformations generally correspond to stable and commonly occurring structural arrangements of protein backbones.
For example, residues in a typical right-handed α-helix cluster around approximately:
φ ≈ −60°
ψ ≈ −45°
Similarly, residues in β-strands occupy an extended region with negative φ and positive ψ values.
10.2 Allowed Regions
Allowed regions contain conformations that are physically reasonable but less frequently observed.
A residue lying outside the most densely populated region is therefore not automatically incorrect. Protein structures contain turns, loops, active-site conformations, and other local geometries that may use less common φ–ψ combinations.
10.3 Disallowed Regions
Disallowed regions contain combinations of φ and ψ that are strongly unfavorable.
Residues located in these regions may indicate a modeling problem or unusual local structural strain.
However, structural interpretation should always consider the surrounding experimental evidence. A single unusual residue can sometimes be biologically meaningful rather than representing an error.
11. Relationship Between the Ramachandran Plot and Secondary Structure
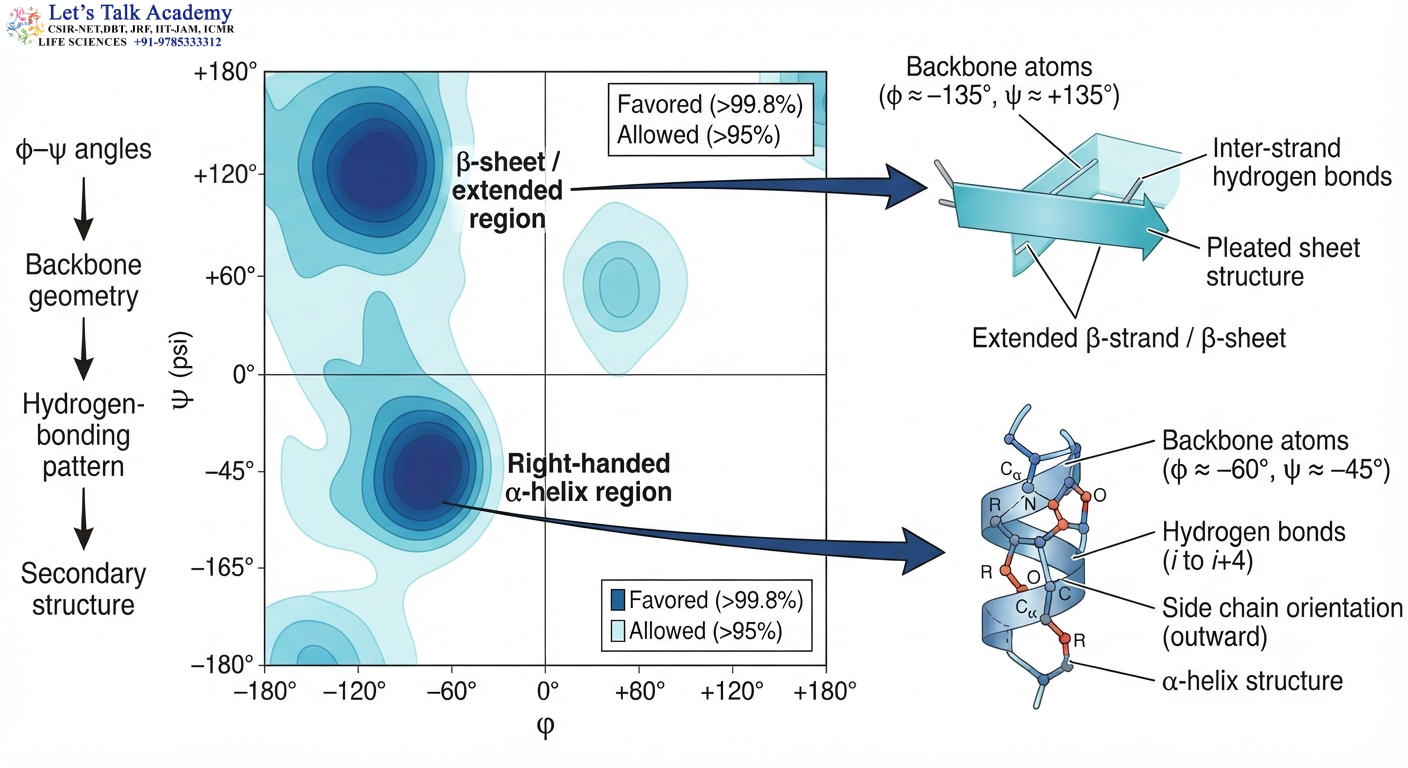
One of the most useful features of the Ramachandran plot is its relationship with protein secondary structure.
Secondary structures are generated when particular backbone conformations are repeated along a polypeptide chain.
The α-helix is characterized by a recurring set of φ and ψ values. Similarly, β-strands occupy a characteristic extended region of the plot.
Thus, a secondary structure can be viewed as a repeated pattern of local backbone conformations.
This relationship can be summarized as:
Specific φ and ψ values
↓
Repeated backbone geometry
↓
Regular hydrogen-bonding pattern
↓
Secondary structure
The Ramachandran plot therefore provides a geometric explanation for why certain regions of protein conformational space correspond to recognizable secondary structures.
12. β-Sheet or Extended Region
The β-sheet or extended region is generally located in the upper-left portion of the conventional Ramachandran plot.
Typical values are approximately:
φ ≈ −120° to −150°
ψ ≈ +110° to +150°
A representative value often used to visualize the center of this region is:
φ ≈ −135°
ψ ≈ +135°
These values are approximate and should not be treated as fixed values for every β-strand residue.
In a β-strand, the polypeptide backbone adopts an extended geometry. Multiple β-strands can then associate through hydrogen bonding to form β-sheets.
The actual distribution of φ and ψ values depends on the local sequence, whether the sheet is parallel or antiparallel, and the surrounding structural environment.
13. Right-Handed α-Helical Region
The most common α-helical structure in proteins is the right-handed α-helix.
Residues in a conventional right-handed α-helix generally occupy the lower-left region of the Ramachandran plot.
Typical values are approximately:
φ ≈ −60°
ψ ≈ −45°
These repeated backbone angles create the geometry required for the α-helix.
The α-helix is stabilized primarily by hydrogen bonds between the backbone carbonyl oxygen of one residue and the backbone amide hydrogen of a residue approximately four positions farther along the chain.
Thus, the regularity of φ and ψ values is closely connected with the regularity of the hydrogen-bonding pattern.
14. Left-Handed α-Helical Region
A smaller region in the upper-right portion of the Ramachandran plot corresponds to left-handed helical conformations.
Representative values are approximately:
φ ≈ +60°
ψ ≈ +40°
For most amino acids, this region is less favorable than the region corresponding to the right-handed α-helix.
Glycine is an important exception because it has a hydrogen atom as its side chain and therefore experiences substantially less steric restriction around the Cα atom.
As a result, glycine can occupy the left-handed helical region more readily than most other amino acids.
15. Polyproline II Helix
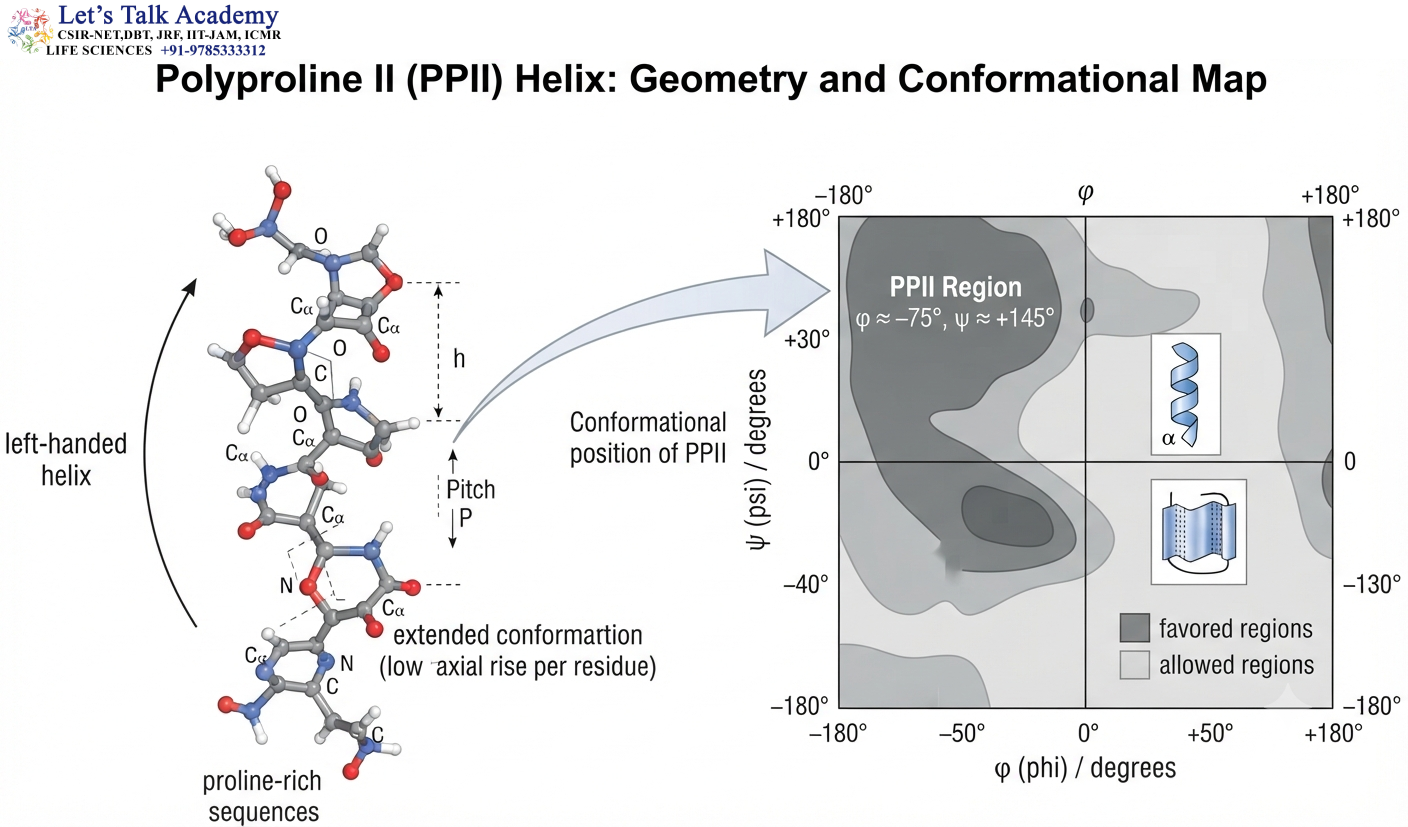
The polyproline II (PPII) helix is another important extended conformation of polypeptide chains.
It generally occupies a region characterized approximately by:
φ ≈ −75°
ψ ≈ +145°
The PPII helix is an extended, left-handed helical conformation. It is particularly common in proline-rich sequences and can also occur in flexible protein regions and peptide segments involved in molecular recognition.
The PPII conformation is structurally important because it can participate in protein–protein interactions and can act as a preferred conformation in unfolded or intrinsically disordered regions.
16. Glycine and Its Special Ramachandran Distribution

Glycine has a unique structural position among the standard amino acids because its side chain is simply:
R = H
For most amino acids, the Cα atom is attached to a Cβ atom that leads into the side chain. Glycine lacks this additional carbon atom.
Consequently, glycine experiences significantly less steric hindrance.
Its backbone can therefore adopt a much broader range of φ and ψ values.
This greater flexibility is reflected in the Ramachandran plot, where glycine occupies a much larger conformational region than most other residues.
Glycine is frequently found in turns and loops because its flexibility allows the backbone to adopt geometries that would be difficult for residues with larger side chains.
The same flexibility can also be unfavorable in regions where a protein requires a rigid and well-defined backbone.
Thus, glycine can be viewed as a residue that increases local conformational freedom.
17. Proline and Its Restricted Conformation
Proline displays a strikingly different behavior from glycine.
Its side chain forms a five-membered ring that includes the backbone nitrogen:
–N–Cα–CH₂–CH₂–CH₂–
This cyclic structure restricts rotation around the N–Cα bond.
As a consequence, the φ angle of proline is strongly constrained compared with that of most other amino acids.
Proline therefore occupies a relatively narrow region of the Ramachandran plot.
This conformational rigidity gives proline important structural functions. It can introduce bends into polypeptide chains, contribute to turns, terminate or disrupt regular α-helical structures, and restrict the flexibility of protein loops.
Proline is also unusual because the peptide bond preceding proline has a relatively higher probability of adopting the cis configuration than ordinary peptide bonds.
18. Glycine Versus Proline
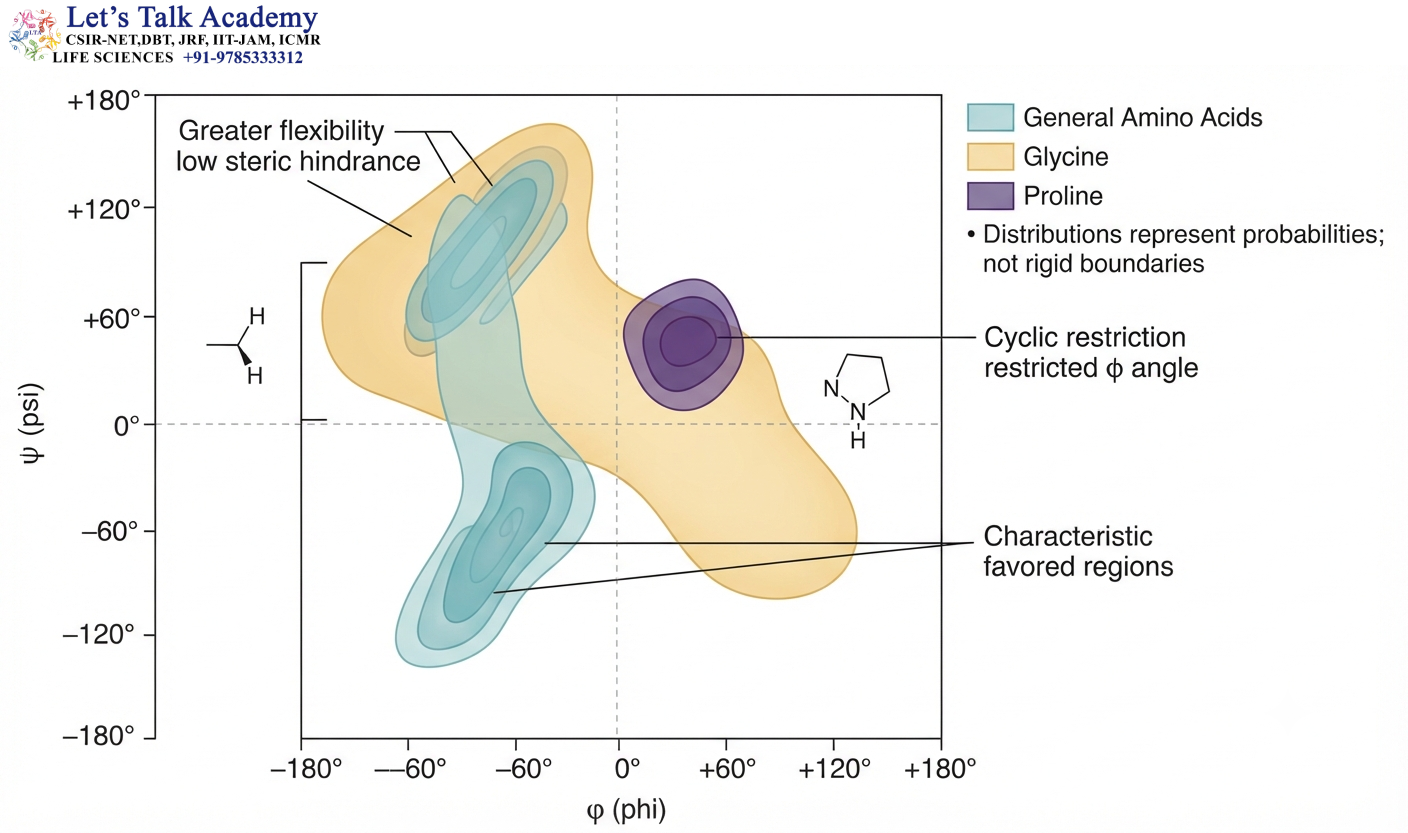
Glycine:
Small side chain → low steric hindrance → greater conformational freedom
Proline:
Cyclic side chain → restricted rotation → limited conformational freedom
Therefore, glycine and proline often have distinct Ramachandran distributions from the other amino acids.
This distinction is important when evaluating protein structures because a φ–ψ combination that is unusual for an ordinary residue may be completely reasonable for glycine.
19. Pre-Proline Residues
The residue immediately preceding proline is called a pre-proline residue.
The presence of proline in the next position affects the conformational preferences of the preceding residue.
Therefore, modern protein structure validation often considers pre-proline residues separately from ordinary residues.
This is an example of an important principle in structural biology: the conformational behavior of a residue is influenced not only by its own side chain but also by neighboring residues.
20. Steric Hindrance in Detail
Steric hindrance results from the physical volume occupied by atoms.
When the backbone rotates around the N–Cα or Cα–C bond, atoms change their relative positions.
At certain φ–ψ combinations, nonbonded atoms become too close. This creates repulsive van der Waals interactions and increases the energy of the conformation.
A simplified relationship can be expressed as:
Unfavorable atomic proximity → increased steric repulsion → increased conformational energy
In contrast:
Favorable atomic arrangement → reduced steric repulsion → lower conformational energy
The Ramachandran plot therefore provides a convenient graphical representation of the conformational consequences of atomic geometry.
21. Side-Chain Effects on Ramachandran Conformation
The Ramachandran plot is primarily a map of backbone geometry, but the side chain strongly influences the available backbone conformations.
Large, branched, or conformationally constrained side chains can restrict φ and ψ values.
For example, valine and isoleucine possess branched side chains near the Cβ atom, which can increase steric restrictions.
Proline imposes a particularly strong restriction because its side chain forms a ring with the backbone nitrogen.
Glycine, in contrast, lacks a conventional side chain beyond hydrogen and therefore has the broadest conformational freedom.
Thus, amino acid identity must be considered when interpreting the distribution of points on a Ramachandran plot.
22. Ramachandran Plot and Protein Folding

Protein folding is not a random process in which every theoretically possible backbone conformation is equally accessible.
As a newly synthesized polypeptide folds, its backbone explores conformational space. Steric restrictions immediately eliminate many possibilities, while favorable interactions stabilize particular conformations.
The Ramachandran plot represents one aspect of this restricted conformational space.
A residue can move from one allowed region to another only through changes in its φ and ψ angles. Large-scale folding therefore involves coordinated changes in the conformations of many residues.
However, the Ramachandran plot alone cannot predict the final folded structure because protein folding also depends on side-chain packing, hydrophobic interactions, hydrogen bonding, electrostatic interactions, solvent effects, disulfide bonds, and other factors.
It is therefore better understood as a local backbone-conformation map rather than a complete protein-folding map.
23. Ramachandran Plot and Energy
Every possible φ–ψ combination is associated with a particular energetic state.
Highly unfavorable combinations have high steric and conformational energy.
Frequently observed combinations generally correspond to lower-energy or otherwise favorable states.
A simplified energy relationship can be represented as:
Steric clash → high energy → low probability
Favorable geometry → lower energy → higher probability
The real energy surface is more complicated because the protein environment contributes additional interactions. Nevertheless, this energetic perspective provides an intuitive way to understand why the Ramachandran plot contains dense regions separated by large areas of low probability.
24. Ramachandran Plot and Protein Structure Validation

The Ramachandran plot is widely used in the validation of experimentally determined protein structures.
Protein coordinates obtained from structural methods such as X-ray crystallography, nuclear magnetic resonance (NMR) spectroscopy, and cryo-electron microscopy (cryo-EM) must be assessed for stereochemical consistency.
A Ramachandran analysis examines whether the backbone dihedral angles of individual residues are consistent with known structural distributions.
A protein structure with most residues in favored regions and very few unusual residues generally has better backbone stereochemical quality than a structure containing a large number of outliers.
However, the percentage of residues in favored regions should not be interpreted in isolation. Other structural validation parameters must also be considered.
25. Ramachandran Outliers
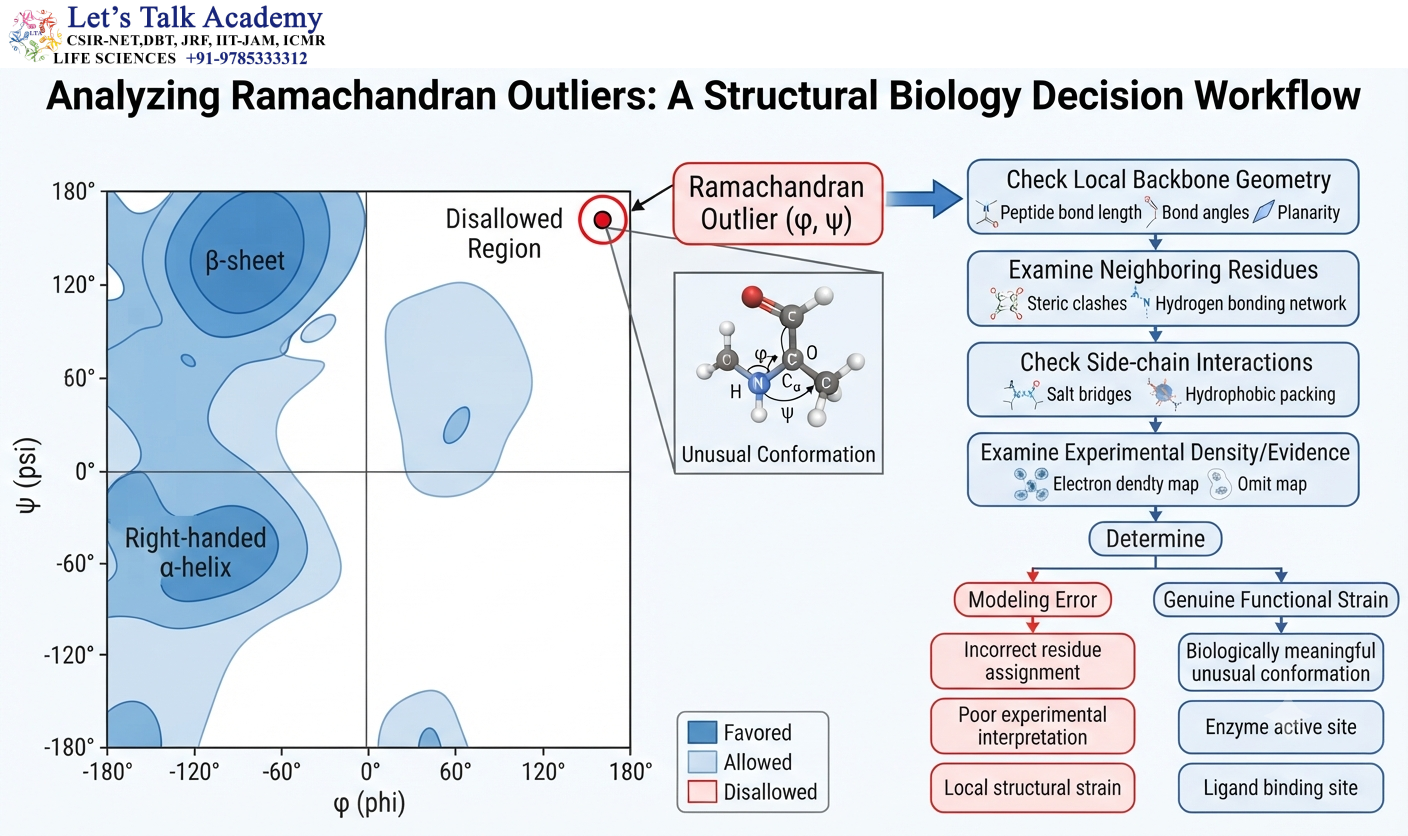
A Ramachandran outlier is a residue whose φ and ψ values fall outside the expected favored or allowed conformational regions.
An outlier may indicate:
Model-building error
Incorrect residue assignment
Poor experimental interpretation
Local structural strain
or a genuinely unusual but biologically meaningful conformation.
For this reason, an outlier should not automatically be corrected simply because its point lies outside a favored region.
A researcher should examine the local experimental evidence, neighboring residues, backbone geometry, side-chain interactions, and biological role of the region.
For example, active sites can contain strained conformations that contribute to catalysis. A protein may deliberately use an unusual geometry because it provides a functional advantage.
26. Ramachandran Plot in Structural Biology
The Ramachandran plot has become a standard concept in structural biology because it converts complex three-dimensional information into an easily interpretable two-dimensional representation.
Suppose a protein contains 200 amino acid residues. Each residue has a corresponding φ and ψ pair. Plotting all 200 pairs produces a distribution of 200 points.
If the protein contains several α-helices, many points will cluster around the α-helical region.
If it contains extensive β-sheet structure, many points will appear in the β-region.
Residues in loops and turns may occupy a broader variety of conformational regions.
The overall pattern therefore provides a useful structural fingerprint of the protein backbone.
27. Ramachandran Plot and Protein Secondary Structure Prediction
Although the Ramachandran plot is primarily used for structural analysis rather than direct secondary-structure prediction, the relationship between φ–ψ distributions and secondary structures is highly informative.
An α-helix requires a relatively regular series of backbone dihedral angles.
A β-strand also requires a characteristic extended geometry.
Therefore, when residues are observed to occupy particular regions of the Ramachandran plot repeatedly, these distributions can help explain the structural organization of the protein.
The important relationship is:
Backbone dihedral angles → local geometry → hydrogen-bonding arrangement → secondary structure
This is one of the clearest examples of how molecular geometry determines biological structure.
28. Ramachandran Plot and Turns
Turns are regions in which a polypeptide chain changes direction.
Unlike regular α-helices and β-strands, turns often require residues to adopt less common φ–ψ combinations.
This is why the Ramachandran distribution of residues in loops and turns can be more diverse.
Glycine is particularly useful in many turns because it can accommodate unusual backbone geometries.
Proline can also be important because its restricted geometry can help stabilize particular bends.
Thus, the special conformational behavior of glycine and proline contributes directly to the structural diversity of protein turns.
29. Relationship Between Sequence and Conformation
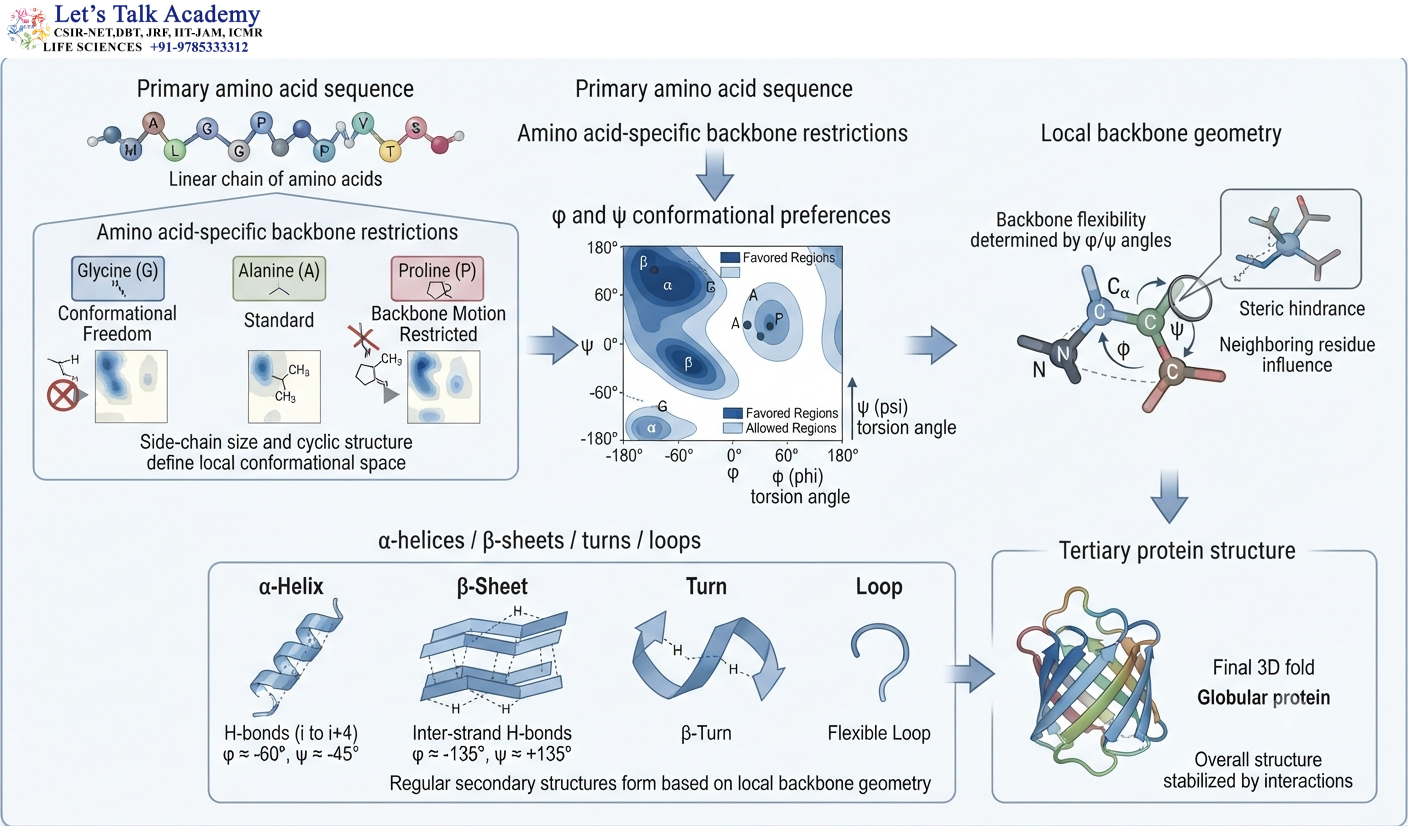
The amino acid sequence strongly influences the conformational preferences of a protein.
Different amino acids impose different restrictions on the backbone, and neighboring residues can influence one another.
Therefore, protein conformation is not determined only by the φ and ψ values of isolated residues. It emerges from the interaction between sequence, local backbone geometry, side-chain properties, and long-range interactions.
The Ramachandran plot captures one important layer of this relationship by showing which backbone conformations are accessible to each residue.
This provides a useful bridge between:
Primary structure → local conformational preferences → secondary structure → tertiary structure
30. Conformational Space of Proteins
The theoretical number of possible conformations of a polypeptide can become extremely large as chain length increases. However, the protein backbone is not free to occupy every possible state.
The peptide bond restricts rotation.
Steric interactions eliminate unfavorable combinations.
Side-chain geometry further restricts local conformations.
Hydrogen bonds stabilize specific arrangements.
Long-range interactions favor particular folded states.
As a result, the biologically relevant conformational space is much smaller than the theoretical space.
The Ramachandran plot provides a simple representation of this restriction at the level of individual backbone residues.
31. Typical Dihedral Angles of Major Protein Conformations

Structural conformation |
Approximate φ |
Approximate ψ |
General location |
|---|---|---|---|
| Right-handed α-helix | −60° | −45° | Lower-left |
| β-sheet / extended | −135° | +135° | Upper-left |
| Left-handed α-helix | +60° | +40° | Upper-right |
| Polyproline II helix | −75° | +145° | Extended upper-left region |
These values represent approximate centers of commonly observed conformational distributions. They are not universal fixed values for every residue.
32. Why the Ramachandran Plot Is Not a Simple Quadrant Diagram
It is tempting to memorize the Ramachandran plot only as four quadrants, but such an approach misses the structural meaning of the diagram.
The important feature is not simply whether φ or ψ is positive or negative. What matters is the specific combination of φ and ψ and the probability associated with that combination.
For example, two residues can both have negative φ values but still occupy completely different structural regions because their ψ values differ.
Therefore, the Ramachandran plot should be understood as a continuous conformational landscape rather than a collection of four independent boxes.
33. Residue-Specific Ramachandran Distributions
A modern Ramachandran analysis often uses residue-specific probability distributions.
This is necessary because glycine, proline, pre-proline residues, and ordinary residues have different conformational preferences.
A single set of allowed regions cannot accurately describe every amino acid.
For example, a φ–ψ combination that is relatively common for glycine may be highly unusual for alanine or valine.
Therefore, protein-structure validation systems frequently use residue-specific reference distributions to provide more accurate assessments.
34. Ramachandran Plot and Molecular Modeling
The Ramachandran plot is also useful during protein modeling and refinement.
When building a protein model, a researcher can examine whether the proposed backbone conformations fall within physically reasonable regions.
If several residues fall into strongly unfavorable regions, the model may require refinement.
This can be particularly useful when interpreting experimental structural data that are incomplete or of limited resolution.
The Ramachandran plot therefore serves not only as a post-analysis validation method but also as a guide during structure construction and refinement.
35. Ramachandran Plot and Mutations
A mutation can alter local backbone conformation by changing the size, branching, polarity, or conformational constraints of an amino acid side chain.
For example, replacing a small residue with a bulky residue can make a previously accessible φ–ψ combination less favorable.
Similarly, introducing proline into a flexible region can strongly restrict backbone movement.
Replacing proline with glycine can have the opposite effect by increasing local conformational flexibility.
Therefore, changes in amino acid sequence can sometimes be reflected in changes in the Ramachandran distribution of a protein.
36. Ramachandran Plot and Protein Function
Protein function often depends on precise three-dimensional geometry.
Enzymes require active-site residues to adopt orientations that allow substrate binding and catalysis.
Receptors require appropriate conformations for ligand recognition and signal transmission.
Structural proteins require stable arrangements that provide mechanical strength.
Therefore, conformational restrictions represented by the Ramachandran plot ultimately contribute to biological function.
A protein cannot adopt arbitrary backbone geometries because its function depends on maintaining a specific structural organization.
37. Important Relationship Between Backbone Flexibility and Stability
Protein flexibility and stability are closely related but are not identical.
A highly flexible backbone can explore many conformations, whereas a highly restricted backbone can occupy fewer conformations.
Glycine generally increases local flexibility, while proline tends to restrict local backbone motion.
However, whether flexibility stabilizes or destabilizes a protein depends on the complete structural context.
A protein must balance conformational freedom with the need to maintain a stable functional structure.
The Ramachandran plot provides a useful way to visualize one component of this balance.
38. A Conceptual Representation of the Ramachandran Plot
The Ramachandran plot is a graphical representation of the conformational possibilities available to the backbone of a polypeptide chain. It describes the relationship between the two principal backbone dihedral angles, φ (phi) and ψ (psi), for amino acid residues in a protein.
The basic organization of a Ramachandran plot can be represented as follows:
- Horizontal axis: Represents the φ (phi) dihedral angle, ranging from approximately −180° to +180°.
- Vertical axis: Represents the ψ (psi) dihedral angle, also ranging from approximately −180° to +180°.
- Lower-left region: Commonly associated with right-handed α-helical conformations.
- Upper-left region: Predominantly associated with β-sheet conformations and extended-chain conformations.
- Upper-right region: Contains conformations associated with left-handed helical structures, although this region is generally much smaller.
- Unfavorable regions: Many combinations of φ and ψ angles are not commonly observed because they produce steric clashes between atoms in the polypeptide backbone.
- Allowed regions: Represent combinations of φ and ψ angles that are sterically permissible and energetically favorable.
- Highly populated regions: Indicate conformations that occur frequently in naturally occurring protein structures.
A simplified conceptual arrangement is:
ψ
+180°
↑
β-sheet region | Left-handed helix region
|
−180° ────────────────┼──────────────── +180° → φ
|
α-helix region
↓
−180°
The boundaries between these regions should not be interpreted as rigid divisions. In an actual Ramachandran plot, the allowed conformations form continuous regions of varying probability and energetic favorability rather than sharply separated boxes.
The distribution of φ and ψ angles is determined primarily by the three-dimensional geometry of the peptide backbone and the steric interactions among its atoms. Because rotation around the peptide bond itself is highly restricted due to its partial double-bond character, most backbone conformational variation occurs around the N–Cα bond, represented by φ, and the Cα–C′ bond, represented by ψ.
Thus, the Ramachandran plot provides a direct way to visualize how the backbone geometry of a protein is constrained and how particular combinations of dihedral angles favor characteristic secondary structures such as α-helices and β-sheets. It is also widely used to evaluate the stereochemical quality of experimentally determined protein structures.
39. Complete Structural Logic of the Ramachandran Plot
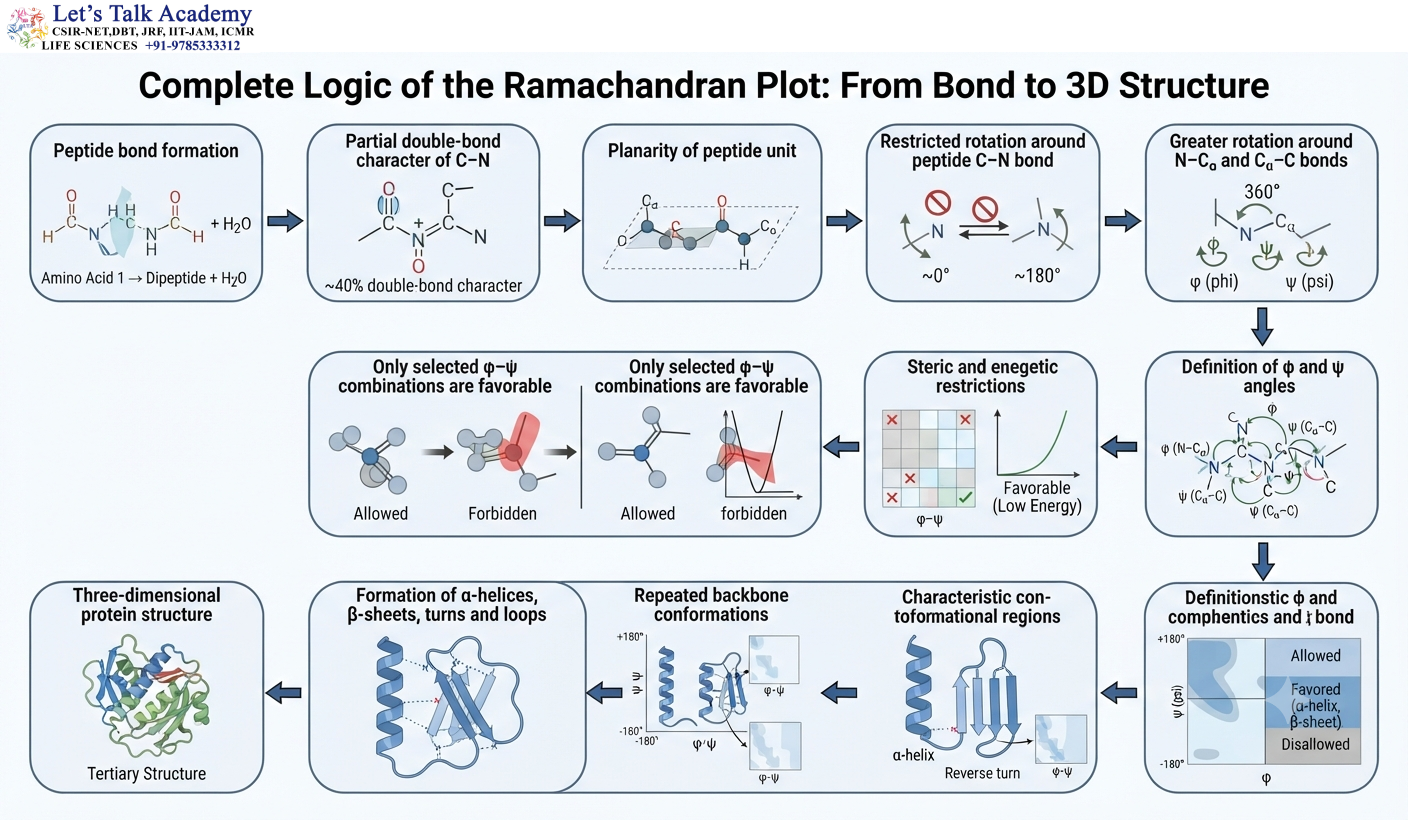
The entire principle can be understood through the following sequence:
Peptide bond formation
↓
Partial double-bond character of C–N
↓
Planarity of peptide unit
↓
Restricted rotation around peptide C–N bond
↓
Greater rotation around N–Cα and Cα–C bonds
↓
Definition of φ and ψ angles
↓
Steric and energetic restrictions
↓
Only selected φ–ψ combinations are favorable
↓
Characteristic conformational regions
↓
Repeated backbone conformations
↓
Formation of α-helices, β-sheets, turns, and loops
↓
Formation of the three-dimensional protein structure
This sequence explains why the Ramachandran plot is fundamental to understanding protein conformation.
40. Ramachandran Plot and Protein Structure Hierarchy
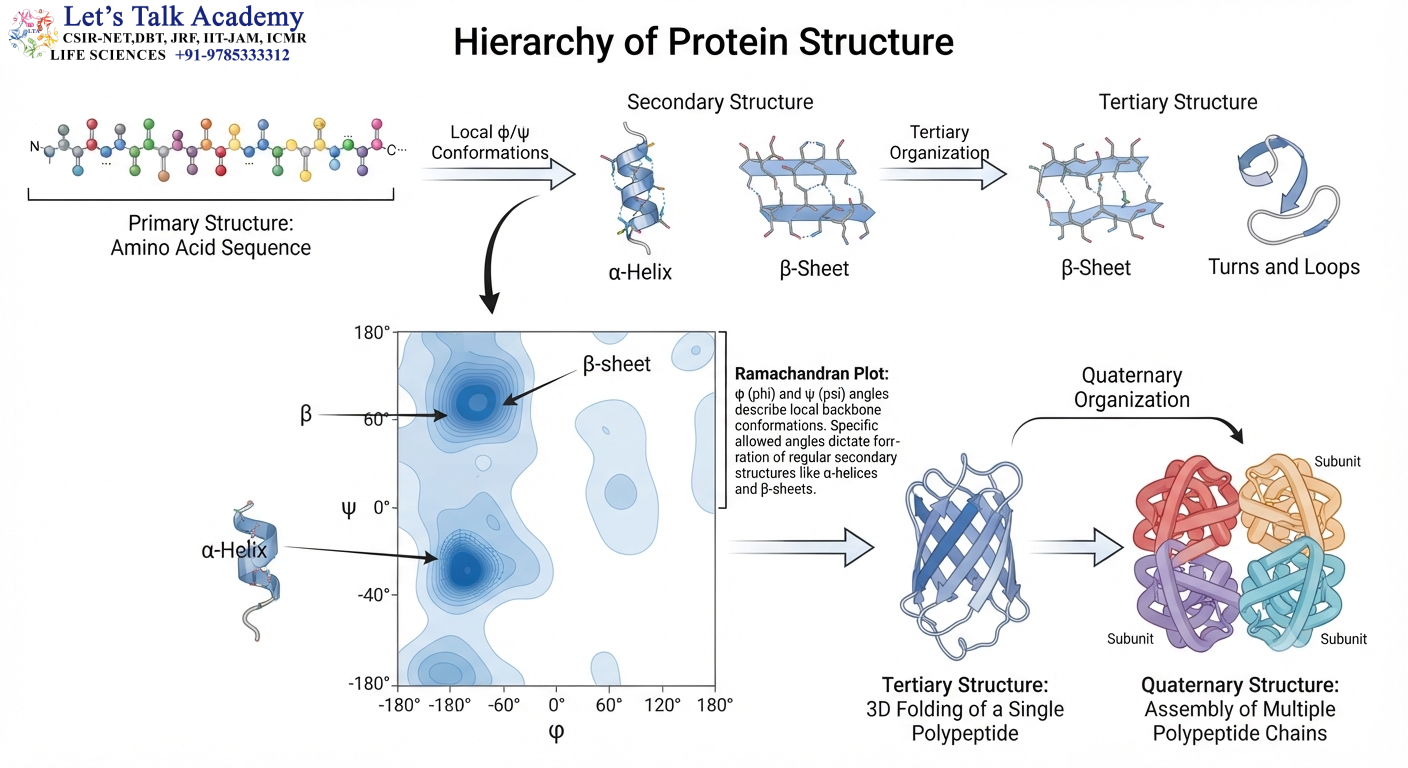
Protein structure can be considered at four major levels.
Primary structure is the amino acid sequence.
Secondary structure includes α-helices, β-sheets, turns, and related local structures.
Tertiary structure is the complete three-dimensional organization of a single polypeptide chain.
Quaternary structure describes the association of multiple polypeptide chains.
The Ramachandran plot primarily describes the local backbone geometry that contributes to secondary structure and ultimately influences tertiary and quaternary organization.
Therefore, although it is a two-dimensional plot, it is directly connected to the three-dimensional architecture of proteins.
41. Limitations of the Ramachandran Plot
The Ramachandran plot is extremely useful, but it does not provide a complete description of protein structure.
It does not directly describe side-chain rotamer conformations, tertiary contacts, hydrophobic packing, solvent accessibility, disulfide bonds, or quaternary interactions.
It also cannot by itself determine whether an entire protein structure is correct.
A residue outside a favored region is not necessarily an error. Some proteins contain genuine unusual conformations that are required for biological function.
Therefore, Ramachandran analysis should be combined with other structural validation methods.
A complete structural assessment may consider:
Bond lengths
Bond angles
Steric clashes
Side-chain rotamers
Experimental density
Backbone geometry
Hydrogen-bonding patterns
Overall structural quality


