48. Which one of the following graphs represents the relative expression of proteins of Wnt-activated signaling cascades involved during development of an embryo?
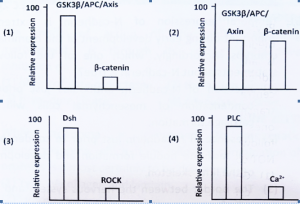
The relative expression of proteins in Wnt-activated signaling cascades during embryo development typically shows distinct patterns based on the specific Wnt pathway involved—canonical (β-catenin dependent) or non-canonical pathways (planar cell polarity (PCP) and Wnt/Ca2+ pathways). During early embryonic development, key Wnt ligands such as Wnt3, Wnt3a, Wnt4, and others are expressed at specific stages like the 8-cell stage and gastrulation. Correspondingly, proteins downstream in these pathways such as Frizzled receptors (FZD5, FZD7, FZD10), LRP co-receptors (LRP5, LRP6), Dishevelled (DVL), β-catenin, and transcription factors like TCF/LEF show dynamic regulated expression reflective of their roles in cell fate determination, polarity, migration, and morphogenesis.
The canonical Wnt/β-catenin pathway features accumulation and nuclear translocation of stabilized β-catenin, activating gene expression essential for body axis specification and germ layer differentiation. Protein expression analysis often reveals early expression of Wnts and receptors, with active β-catenin levels rising around the onset of gastrulation corresponding to developmental milestones. Non-canonical pathways like Wnt/PCP, involving Rho GTPases and other cytoskeletal regulators, have unique protein expression profiles influencing cell shape and movement without involving β-catenin stabilization.
Therefore, a graph representing relative protein expression of Wnt-activated signaling cascades during embryonic development would typically show:
-
Early expression peaks of specific Wnt ligands (e.g., Wnt3, Wnt5a)
-
Corresponding peak or graded expression of Frizzled receptors and LRP5/6 co-receptors
-
Increasing active β-catenin levels coinciding with major developmental transitions
-
Dynamic expression of downstream effectors like Dishevelled (DVL) and TCF/LEF transcription factors
Graphs would reflect a temporal sequence during embryogenesis with certain proteins rising and falling at precise developmental stages to coordinate cell signaling effectively.


