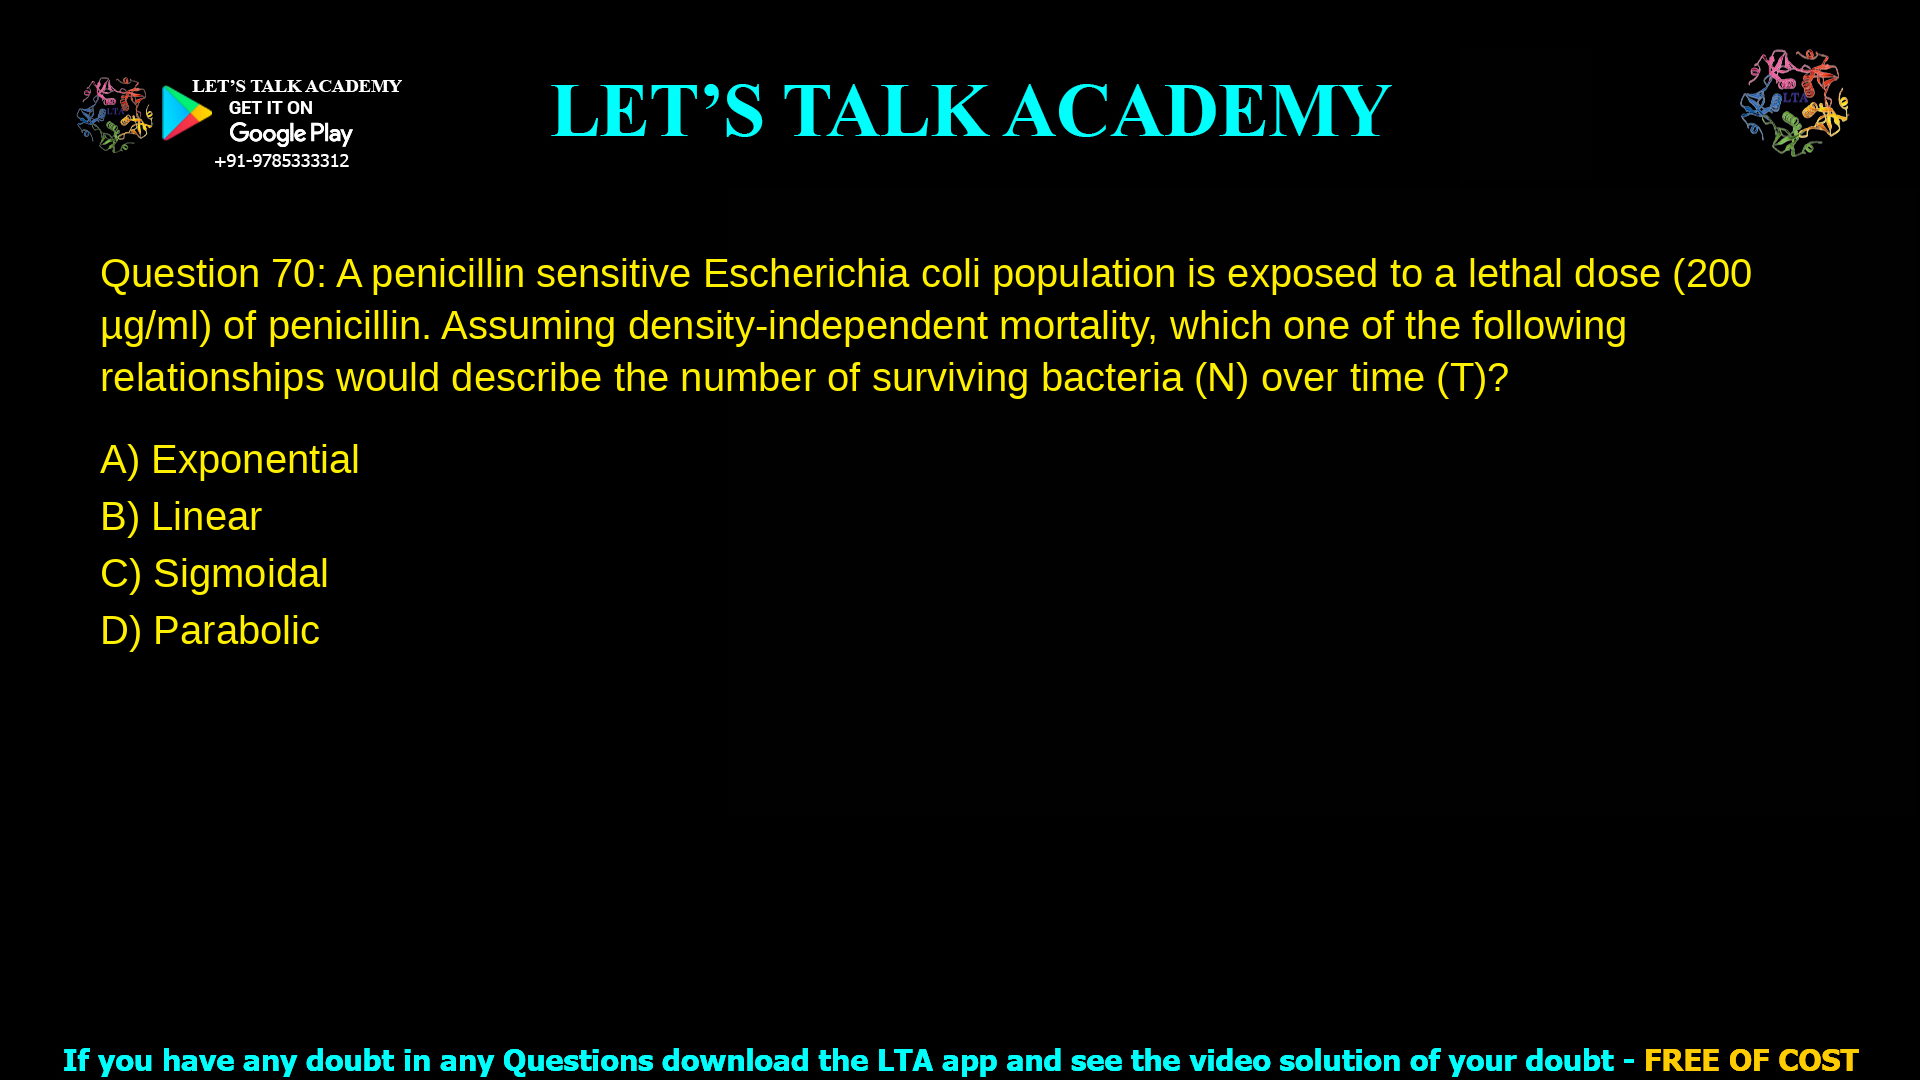
Q.70 A penicillin sensitive Escherichia coli population is exposed to a lethal dose
(200 μg/ml) of penicillin. Assuming density–independent mortality, which
one of the following relationships would describe the number of surviving
bacteria (N) over time (T)?
(A) Exponential
(B) Linear
(C) Sigmoidal
(D) Parabolic
The correct answer is (B) Linear.
Penicillin kills sensitive Escherichia coli by inhibiting cell wall synthesis, leading to lysis during growth, and under density-independent mortality, survivors decline at a constant per-cell rate. This produces a straight line on a semi-log plot of survivors (N) versus time (T), but linear on an arithmetic scale as specified.
Option Analysis
- Exponential: Matches log-linear decline (constant fractional kill rate, N = N0e-kT) on semi-log plots, common in antibiotic literature, but arithmetic N vs T curves downward.
- Linear: Constant absolute kill rate (N = N0 – kT) fits density-independent mortality where each bacterium dies independently at fixed probability per unit time, yielding straight decline on linear axes.
- Sigmoidal: Shows initial slow, rapid middle, and tail phases (e.g., biphasic killing or persistence), not uniform rate.
- Parabolic: Quadratic curve (N ∝ T2) lacks basis in constant-rate killing models.
Density-Independent Killing Mechanics
Penicillin at 200 μg/ml exceeds MIC for sensitive E. coli, saturating penicillin-binding proteins and halting peptidoglycan cross-linking. Density independence means kill rate per cell stays constant, unaffected by population size, unlike density-dependent cases (e.g., resource competition). Models confirm dN/dt = -kN solves to exponential on log scale, but question phrasing implies arithmetic linear fit for survivors over time.
Understanding Density-Independent Mortality
Density-independent factors like high antibiotic concentrations kill bacteria at a fixed probability per cell per time unit, unaffected by crowding. For penicillin, β-lactam binding to PBPs inhibits cell wall synthesis, causing lysis in growing cells; at lethal doses, this yields uniform per-cell risk. Result: arithmetic plot of survivors (N) versus time (T) shows linear decline (N = N0 – kT), distinguishing from log-linear exponential views.
Survivor Curve Options Decoded
| Curve Type | Shape (N vs T, Arithmetic) | Fit for Penicillin Killing? | Reason |
|---|---|---|---|
| Exponential | Convex downward curve | No | Constant % kill; linear on log N vs T |
| Linear | Straight line decline | Yes | Constant absolute kill rate per cell |
| Sigmoidal | S-shaped (slow-fast-slow) | No | Biphasic/persistence phases |
| Parabolic | U-shaped quadratic | No | No biological basis here |
Linear best matches question assumptions, as ecology texts describe density-independent mortality this way.
Implications for Antibiotic Kinetics
Lethal dose ensures >MIC saturation; E. coli survivor curves often show initial rapid kill, but idealized density-independent models predict linear arithmetic decline until few survivors. CSIR NET aspirants note: semi-log plots standardize to exponential, but query specifies raw N vs T.


1 Comment
Sonal Nagar
January 8, 2026Linear