- The possible relationships between levels of disturbance and species diversity in a biological community are that species diversity
A. is unaffected by disturbance.
B. is highest at intermediate levels of disturbance.
C. decreases exponentially with increasing levels of disturbance.
D. starts decreasing only at higher levels of disturbance.
Match each graph with its corresponding statements above:
(1) 1-D, 2-C, 3-B, 4-D (2) 1-C, 2-D, 3-B, 4-A
(3) 1-A, 2-B, 3-C, 4-D (4) 1-C, 2-A, 3-B, 4-DEcological disturbances—such as fires, floods, storms, or human activities—play a critical role in shaping species diversity within biological communities. The relationship between disturbance intensity and species diversity has been widely studied, leading to important ecological theories like the Intermediate Disturbance Hypothesis (IDH). This article explains how species diversity changes with disturbance levels and helps you match common ecological statements with their corresponding graphical representations.
What Is Ecological Disturbance?
Disturbance refers to any event that disrupts ecosystem structure, alters resource availability, or changes species composition. Disturbances can be natural (e.g., wildfires, hurricanes) or anthropogenic (e.g., deforestation, pollution). Their effects on biodiversity vary depending on frequency, intensity, and duration.
The Four Statements About Disturbance and Species Diversity
When considering how species diversity responds to disturbance, four key patterns are often proposed:
-
A. Species diversity is unaffected by disturbance.
This suggests that disturbance has no impact on the number or abundance of species in a community. -
B. Species diversity is highest at intermediate levels of disturbance.
Known as the Intermediate Disturbance Hypothesis, this states that moderate disturbance prevents competitive exclusion and allows coexistence of diverse species. -
C. Species diversity decreases exponentially with increasing levels of disturbance.
This implies that as disturbance intensifies, species diversity drops sharply, often because many species cannot survive harsh conditions. -
D. Species diversity starts decreasing only at higher levels of disturbance.
Here, diversity remains stable at low disturbance but declines once disturbance surpasses a threshold.
The Intermediate Disturbance Hypothesis (IDH)
The IDH is a central concept explaining why biodiversity peaks at moderate disturbance levels. At low disturbance, dominant species outcompete others, reducing diversity. At high disturbance, many species are eliminated due to harsh conditions. Moderate disturbance creates a dynamic environment where both early- and late-successional species coexist, maximizing diversity.
Matching Graphs to Statements: The Options
You are given four graphs labeled 1 to 4 and four statements A to D. The task is to match each graph with the correct statement.
The Matching Options:
-
(1-D, 2-C, 3-B, 4-D)
-
(1-C, 2-D, 3-B, 4-A)
-
(1-A, 2-B, 3-C, 4-D)
-
(1-C, 2-A, 3-B, 4-D)
Interpreting the Graphs and Correct Matches
Based on ecological principles and the Intermediate Disturbance Hypothesis, here is how the graphs typically correspond to the statements:
-
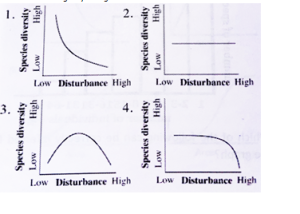
Graph 1: Exponential decline in diversity with increasing disturbance
This matches statement C (species diversity decreases exponentially as disturbance increases). -
Graph 2: Diversity unaffected by disturbance (flat line)
This matches statement A (species diversity is unaffected by disturbance). -
Graph 3: Unimodal curve with peak diversity at intermediate disturbance
This matches statement B (species diversity is highest at intermediate disturbance). -
Graph 4: Diversity stable at low disturbance, then decreases at high disturbance
This matches statement D (diversity starts decreasing only at higher disturbance levels).
Which Option Correctly Matches All?
Looking at the options, Option 4 correctly pairs the graphs with their corresponding statements:
-
1 → C (exponential decline)
-
2 → A (no effect)
-
3 → B (peak at intermediate disturbance)
-
4 → D (decline starts at high disturbance)
Why Are These Matches Important?
Understanding these relationships helps ecologists and conservationists:
-
Predict how ecosystems respond to natural or human-induced disturbances.
-
Develop management strategies that maintain or enhance biodiversity.
-
Recognize that some disturbances can be beneficial at moderate levels.
Summary Table: Disturbance-Diversity Relationships
Graph Number Pattern Description Corresponding Statement Ecological Significance 1 Exponential decrease in diversity C High disturbance drastically reduces diversity 2 No change in diversity despite disturbance A Disturbance has no measurable effect 3 Diversity peaks at intermediate disturbance B Supports Intermediate Disturbance Hypothesis 4 Diversity stable at low disturbance, declines later D Diversity declines only after disturbance passes threshold Conclusion
The relationship between disturbance and species diversity is complex and context-dependent. Among the given options, the correct matching of graphs to statements is:
(4) 1-C, 2-A, 3-B, 4-D
-


6 Comments
Prena Ghangas
October 27, 20251-C, 2-A, 3-B, 4-D
Manisha choudhary
November 6, 20254th option is correct answer
Intermediate distubance hota h tb highest level of diversity hoti h
High disturbance hota h tb decrease hoti h diversity
priti khandal
November 14, 20254th option is correct
Sakshi yadav
November 15, 2025Option 4 correct
Kajal
November 16, 2025Option D
Sakshi Kanwar
November 28, 20251-C, 2-A, 3-B, 4-D
Graph one – High disturbance drastically reduces diversity
2 – Disturbance has no measurable effect
3-Supports Intermediate Disturbance Hypothesis
4-Diversity declines only after disturbance passes threshold