The Lotka-Volterra model of competition between species A and B is given by the equations Species A: dNA/dt = rANA (KA-NA-αNB/KA) Species B: dNB/dt = rBNB (KB-NB-βNA/KB) Given that species […]

The Lotka-Volterra model of competition between species A and B is given by the equations Species A: dNA/dt = rANA (KA-NA-αNB/KA) Species B: dNB/dt = rBNB (KB-NB-βNA/KB) Given that species […]
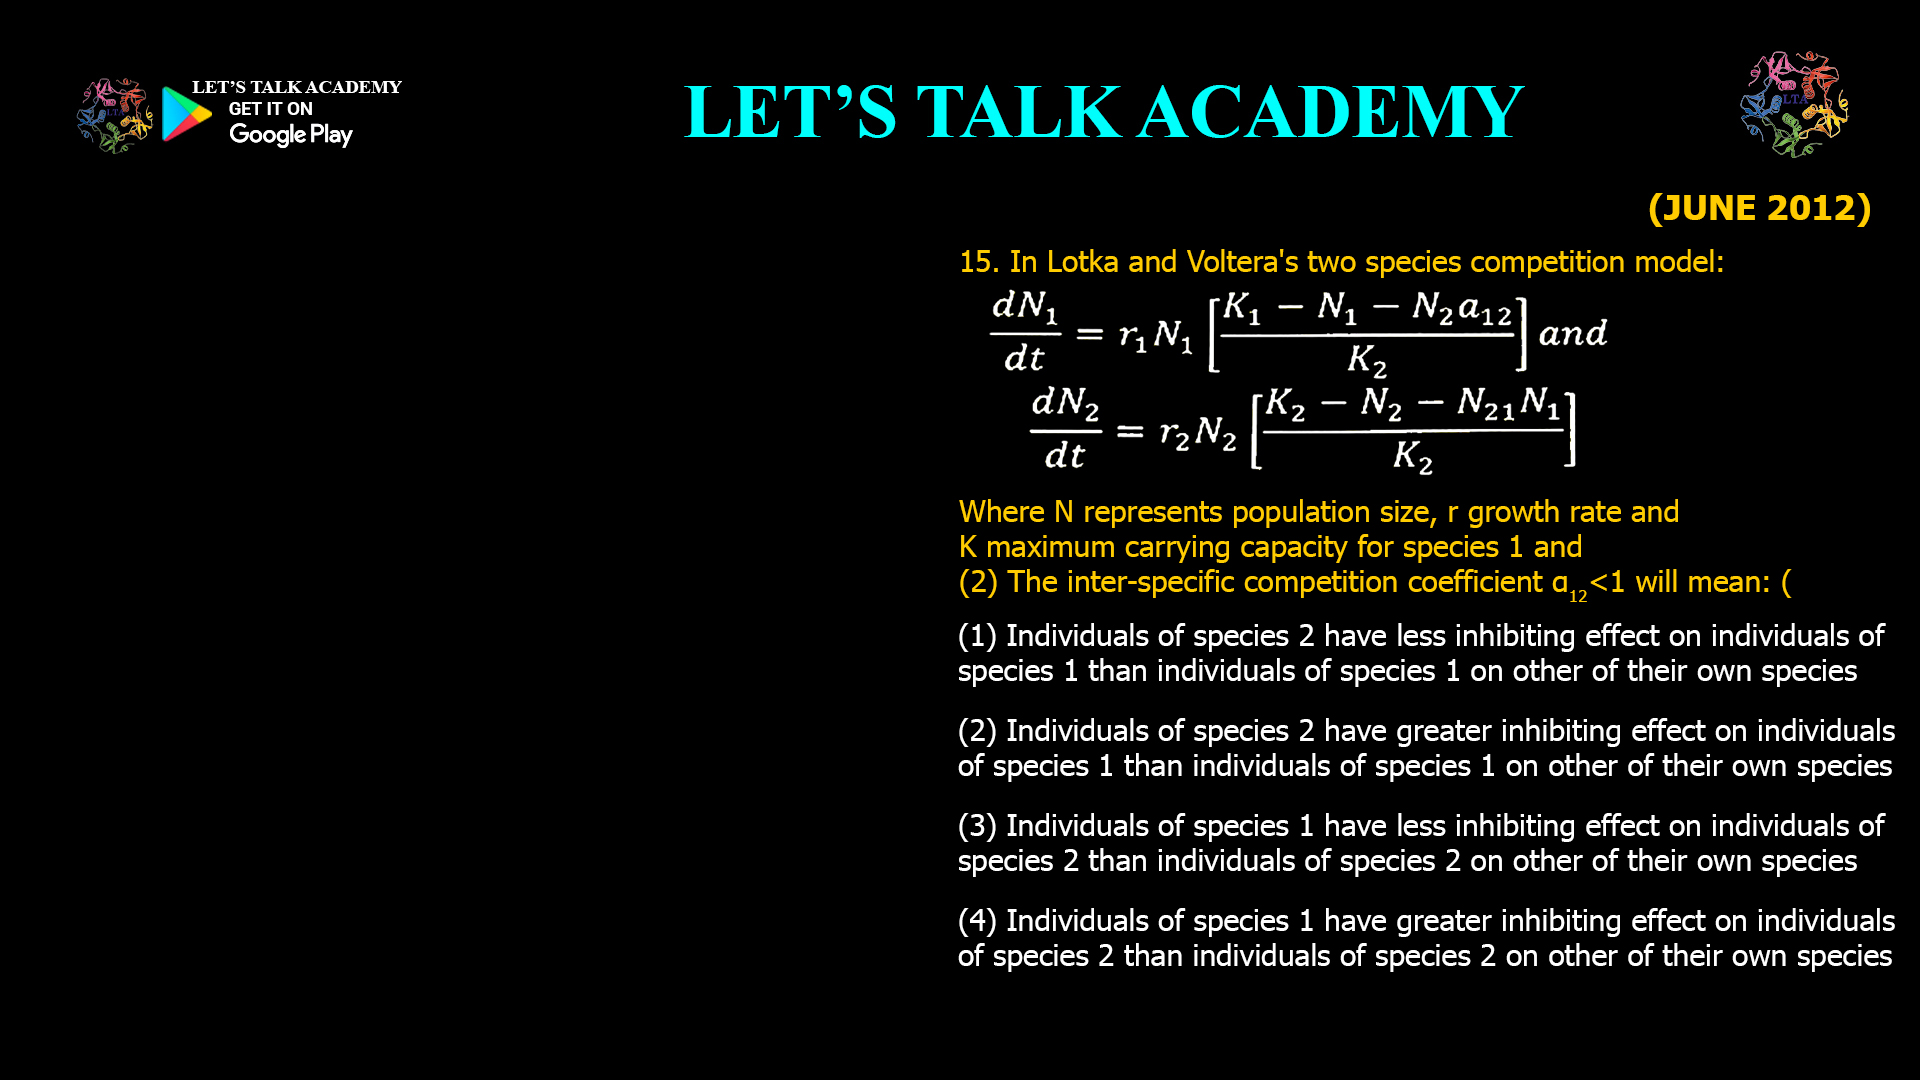
15. In Lotka and Voltera’s two species competition model: Where N represents population size, r growth rate and K maximum carrying capacity for species 1 and (2) The inter-specific competition […]
According to the classical Lotka-Volterra competition model, which of the following conditions allow for co- existence of two competing species? (1) both species are equally capable of inhibiting each other […]
Three islands have identical habitat characteristics. On first island rodent species A is present at a density 325/km2 Second island has only species B at a density of 179/km2 On […]

Second abundant greenhouse gas after CO2is (1) Methane (2) NOx (3) CFC (4) Ozone Understanding the composition and impact of greenhouse gases is crucial in addressing climate change. While […]
Growth patterns of two species (grown alone or together) are shown in Figures A and B. Match the growth patterns with the correct type of interaction represented by them (1) […]

Cyanobacteria out competes the green algae in eutrophic lakes due to organic pollutions because they can (1) tolerate low oxygen level (2) tolerate high phosphorus level (3) fix nitrogen, so […]

The accumulation of DDT has decreased the populationof Brown Pelican ducks because DDT (1) Altered the ducks’s calcium metabolism in a waythat results in thin eggshells. (2) Directly Killed all […]

The following graphs show the population growth of two species P and Q, each growing either alone (a) or in the presence of other species (b). The most important conclusion […]
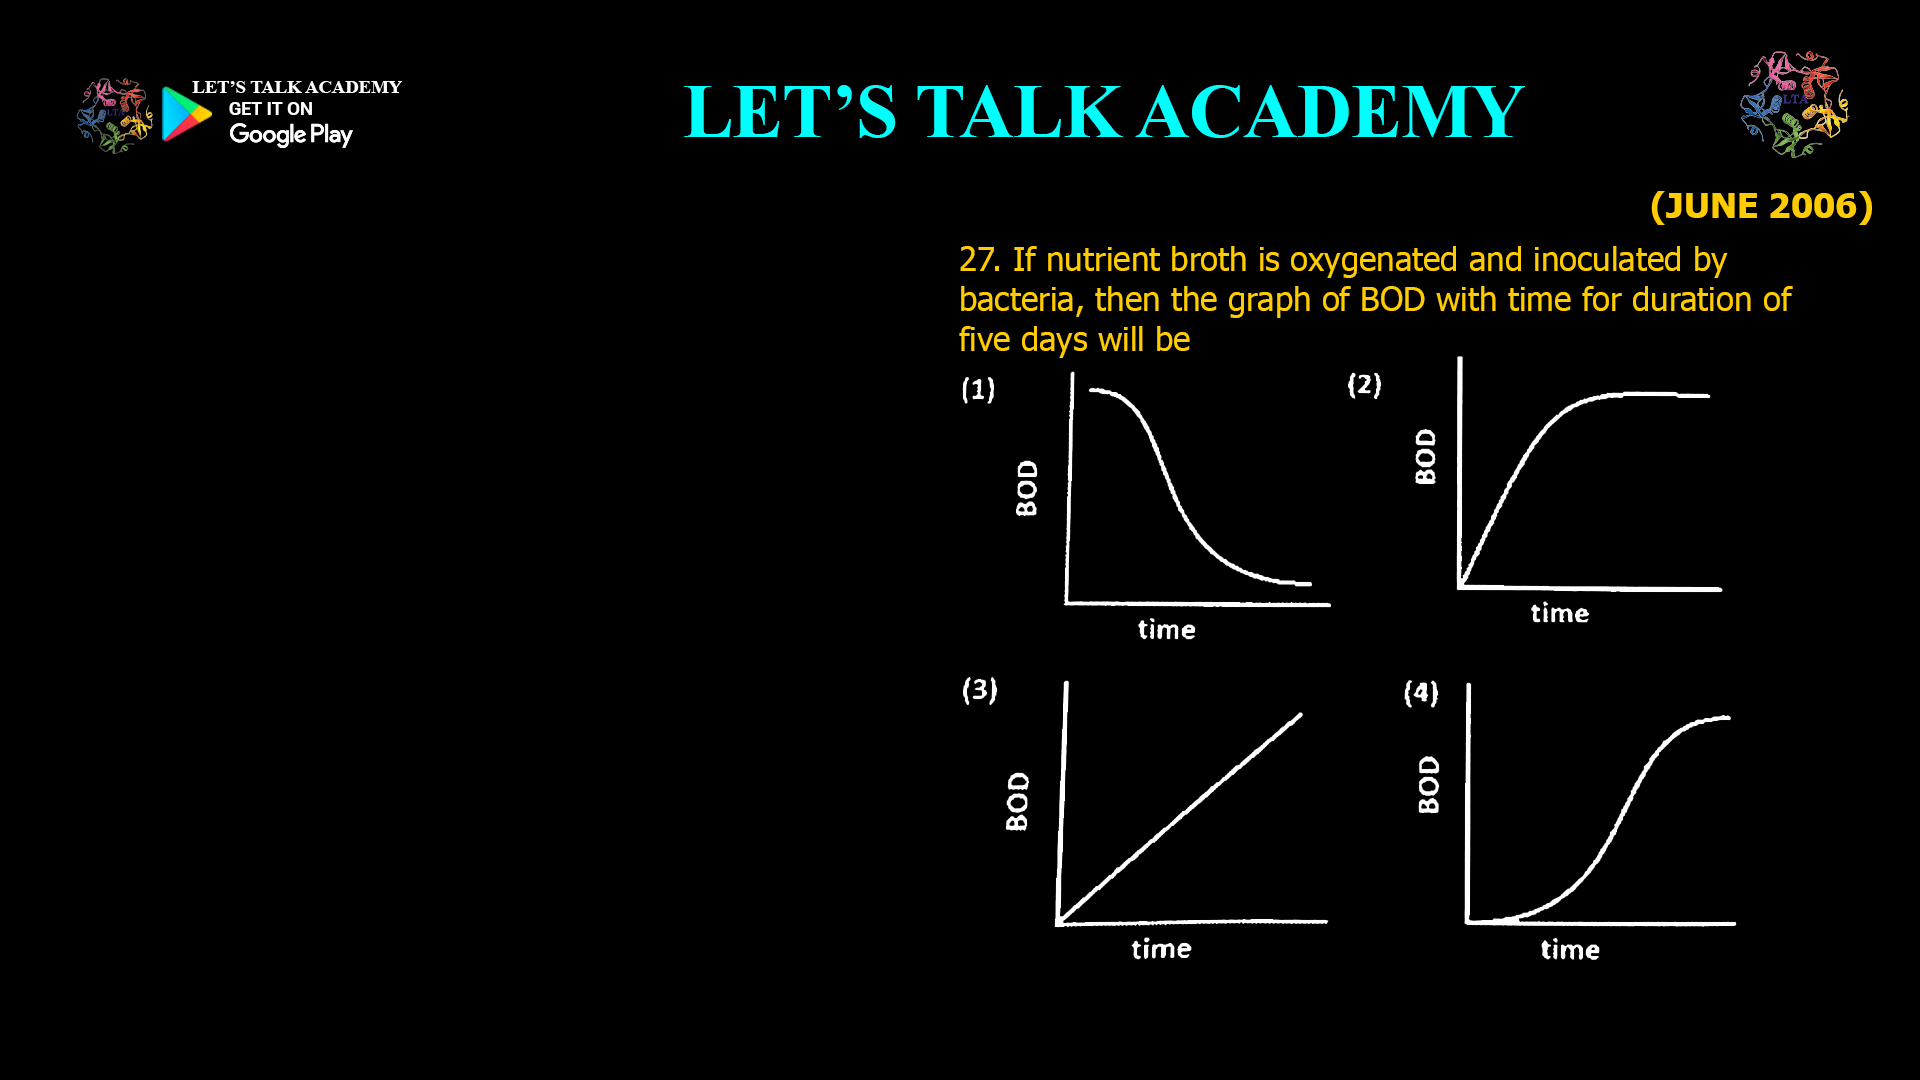
If nutrient broth is oxygenated and inoculated by bacteria, then the graph of BOD with time for duration of five days will be When bacteria are introduced into oxygenated nutrient […]


