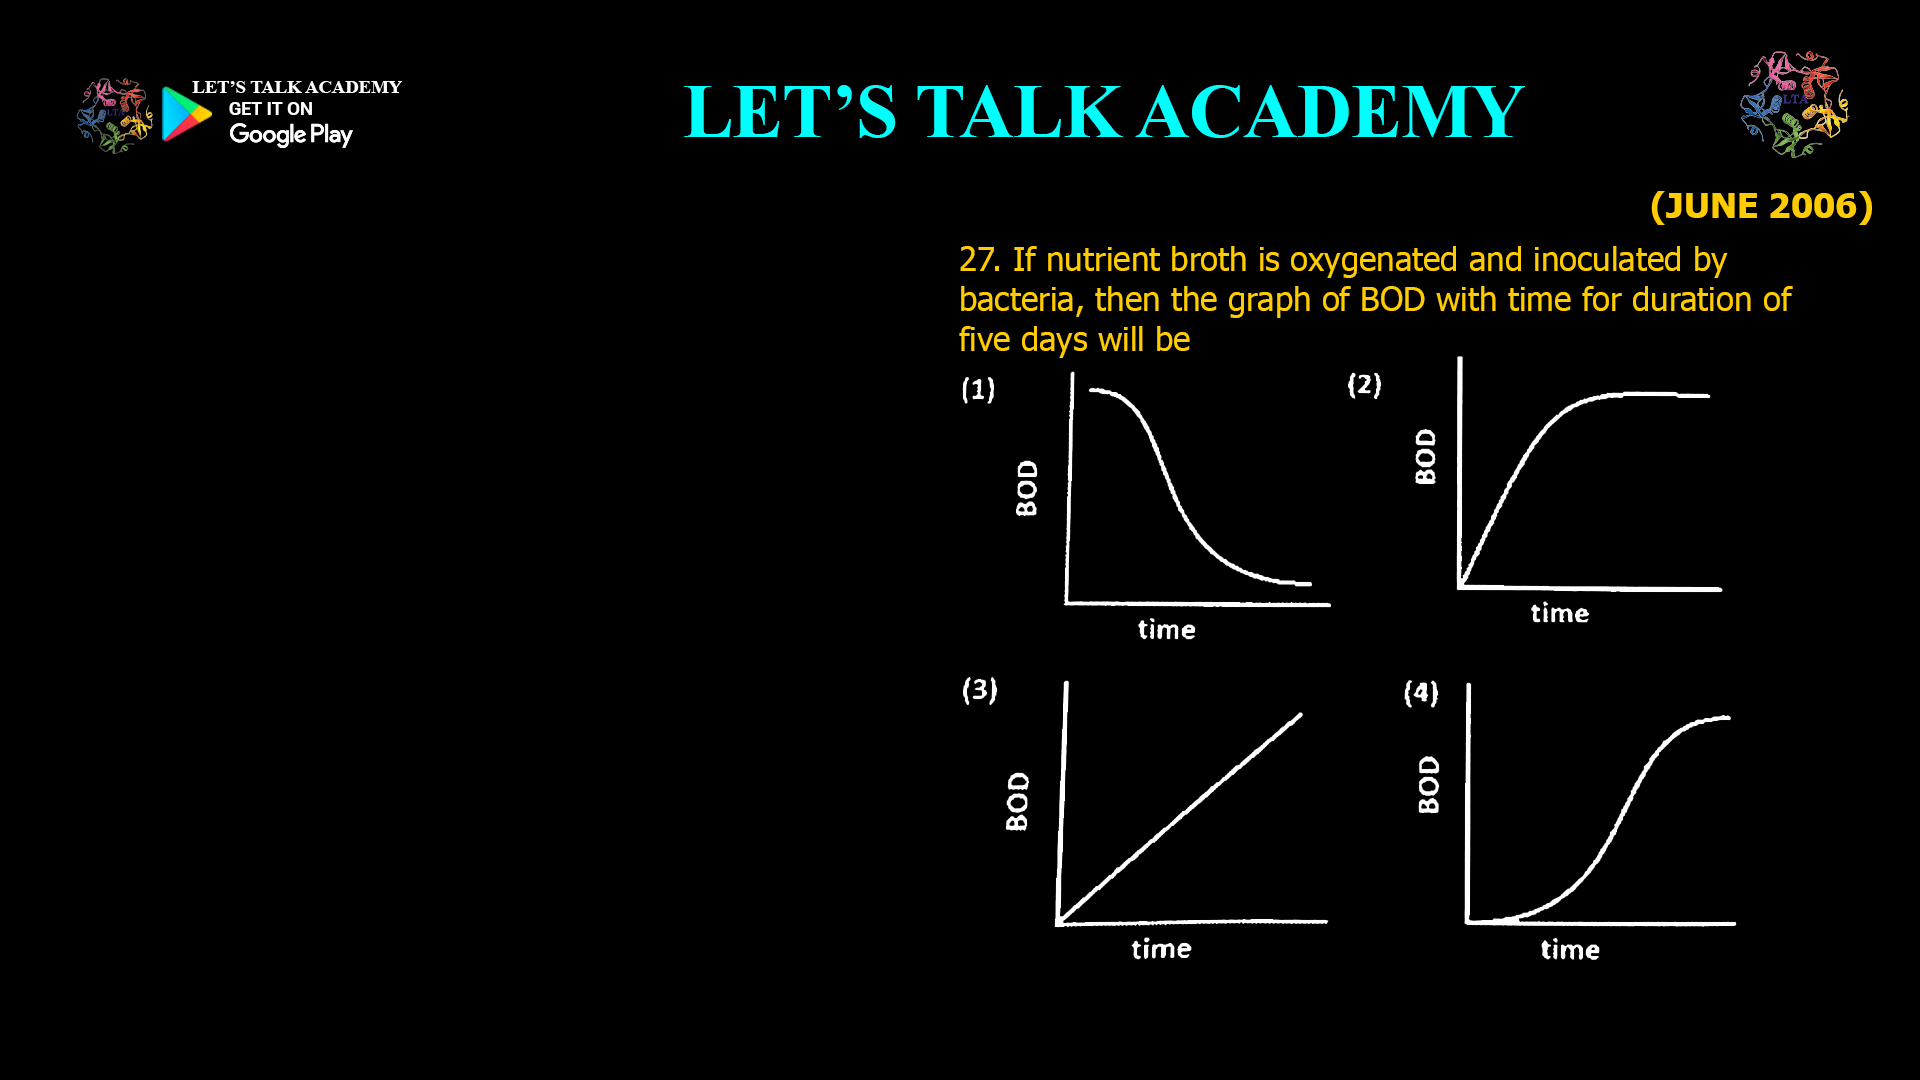
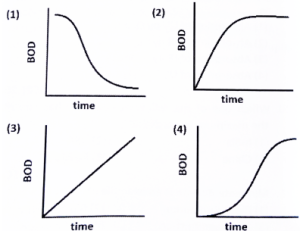
- If nutrient broth is oxygenated and inoculated by bacteria, then the graph of BOD with time for duration of five days will be
When bacteria are introduced into oxygenated nutrient broth, the process of organic matter decomposition begins, and this dynamic is reflected in the Biochemical Oxygen Demand (BOD) over time. BOD is a key parameter in water quality assessment, representing the amount of dissolved oxygen consumed by microorganisms as they break down organic material. Understanding the shape and progression of the BOD curve over a five-day period in an oxygenated, inoculated setup is crucial for environmental science, wastewater treatment, and microbiology. This article explains the typical BOD versus time graph for such an experiment and the biological processes behind it.
What is BOD and Why Does it Matter?
Biochemical Oxygen Demand (BOD) measures the amount of oxygen that aerobic microorganisms require to decompose the organic matter present in water or nutrient broth. It is a critical indicator of water pollution and the strength of organic waste. High BOD values indicate large amounts of organic pollutants, which can deplete oxygen in water bodies, harming aquatic life.
The Experimental Setup
Scenario:
Nutrient broth (a liquid medium rich in organic nutrients) is oxygenated and then inoculated with bacteria.
-
Oxygenated broth: Ensures that oxygen is available for aerobic bacteria to thrive and decompose organic matter.
-
Bacterial inoculation: Introduces active microbial populations that will metabolize the nutrients.
The BOD Curve: What to Expect Over Five Days
When you plot BOD against time for five days in this setup, the graph typically follows a characteristic pattern:
1. Initial Phase (Lag Phase)
-
First few hours to one day
-
BOD rises slowly
-
Explanation:
After inoculation, bacteria are acclimating to their new environment. They begin to metabolize the nutrients but are not yet at their maximum growth rate. Oxygen consumption is relatively low as the population grows.
2. Exponential Growth Phase
-
Day 1 to Day 3
-
BOD increases rapidly
-
Explanation:
As bacteria multiply, they consume more organic matter and oxygen. The BOD rises steeply as the bacterial population grows exponentially and metabolic activity is high. This is the phase where most of the organic matter is broken down.
3. Stationary Phase
-
Day 3 to Day 4
-
BOD increase slows, then plateaus
-
Explanation:
The bacterial population reaches its maximum as nutrients become limiting. The rate of oxygen consumption (BOD) starts to slow down as the rate of organic matter decomposition decreases.
4. Decline Phase (Not always observed in 5 days)
-
Day 4 to Day 5 (and beyond)
-
BOD may stabilize or slightly decrease
-
Explanation:
If the experiment continues, the bacterial population may begin to decline as nutrients are exhausted and waste products accumulate. However, within a standard five-day BOD test, this phase is usually not prominent, and the BOD curve mostly shows a plateau after the exponential phase.
Typical BOD vs. Time Graph
-
X-axis: Time (days)
-
Y-axis: BOD (mg/L)
-
Shape:
-
Slow initial rise (lag phase)
-
Steep increase (exponential growth phase)
-
Leveling off (stationary phase)
-
Graph Description:
The curve starts near zero, rises slowly at first, then increases sharply as bacteria multiply and metabolize the organic matter. After about three days, the curve begins to level off as the rate of oxygen consumption slows, approaching a plateau by the fifth day.
Biological Processes Behind the Curve
-
Lag Phase: Bacteria adapt to the environment, synthesize enzymes, and begin to multiply.
-
Exponential Phase: Rapid bacterial growth and metabolism lead to a sharp increase in oxygen demand.
-
Stationary Phase: Nutrient depletion slows bacterial growth, and oxygen consumption stabilizes.
-
Decline Phase: (If observed) Bacteria die off, and oxygen demand may decrease.
Why Oxygenation Matters
-
Aerobic Conditions: Oxygen is essential for aerobic bacteria to break down organic matter efficiently.
-
Anaerobic Conditions: Without oxygen, decomposition is slower and less efficient, and different byproducts (like methane) are produced.
Standard BOD Test Duration
-
Five-Day BOD (BOD₅):
The standard test measures oxygen consumption over five days at 20°C. This period is chosen because most of the readily biodegradable organic matter is decomposed within this time frame under aerobic conditions.
Key Takeaways
-
BOD increases as bacteria grow and metabolize organic matter in oxygenated nutrient broth.
-
The BOD curve over five days shows a lag phase, followed by a steep rise, and then a plateau as nutrients are depleted.
-
The shape of the curve reflects the growth dynamics of the bacterial population and the availability of nutrients.
-
Oxygen is essential for aerobic decomposition and accurate BOD measurement.
Summary Table
| Phase | Time Frame | BOD Trend | Explanation |
|---|---|---|---|
| Lag | 0–1 day | Slow increase | Bacteria adapt and begin to multiply |
| Exponential Growth | 1–3 days | Rapid increase | Bacterial population and metabolism peak |
| Stationary | 3–5 days | Plateaus | Nutrients become limiting, growth slows |
| Decline (if present) | Beyond 5 days | Decreases/stabilizes | Bacteria die off, nutrients exhausted |
Conclusion
When nutrient broth is oxygenated and inoculated with bacteria, the BOD versus time graph over five days typically shows an initial slow rise (lag phase), followed by a rapid increase (exponential growth phase), and then a plateau (stationary phase) as bacterial growth and metabolism slow due to nutrient depletion. This pattern reflects the dynamic interplay between microbial growth and organic matter decomposition under aerobic conditions.
In summary:
The BOD graph rises slowly at first, then steeply as bacteria multiply, and finally levels off as nutrients are exhausted—typically reaching a plateau by the fifth day.
This understanding is fundamental for interpreting BOD data in environmental and wastewater treatment contexts.


3 Comments
Kirti Agarwal
November 6, 2025Graph 4
Kajal
November 15, 2025Option 4
Sakshi Kanwar
November 28, 2025Declined curve option 4 when the nutrient are exhausted