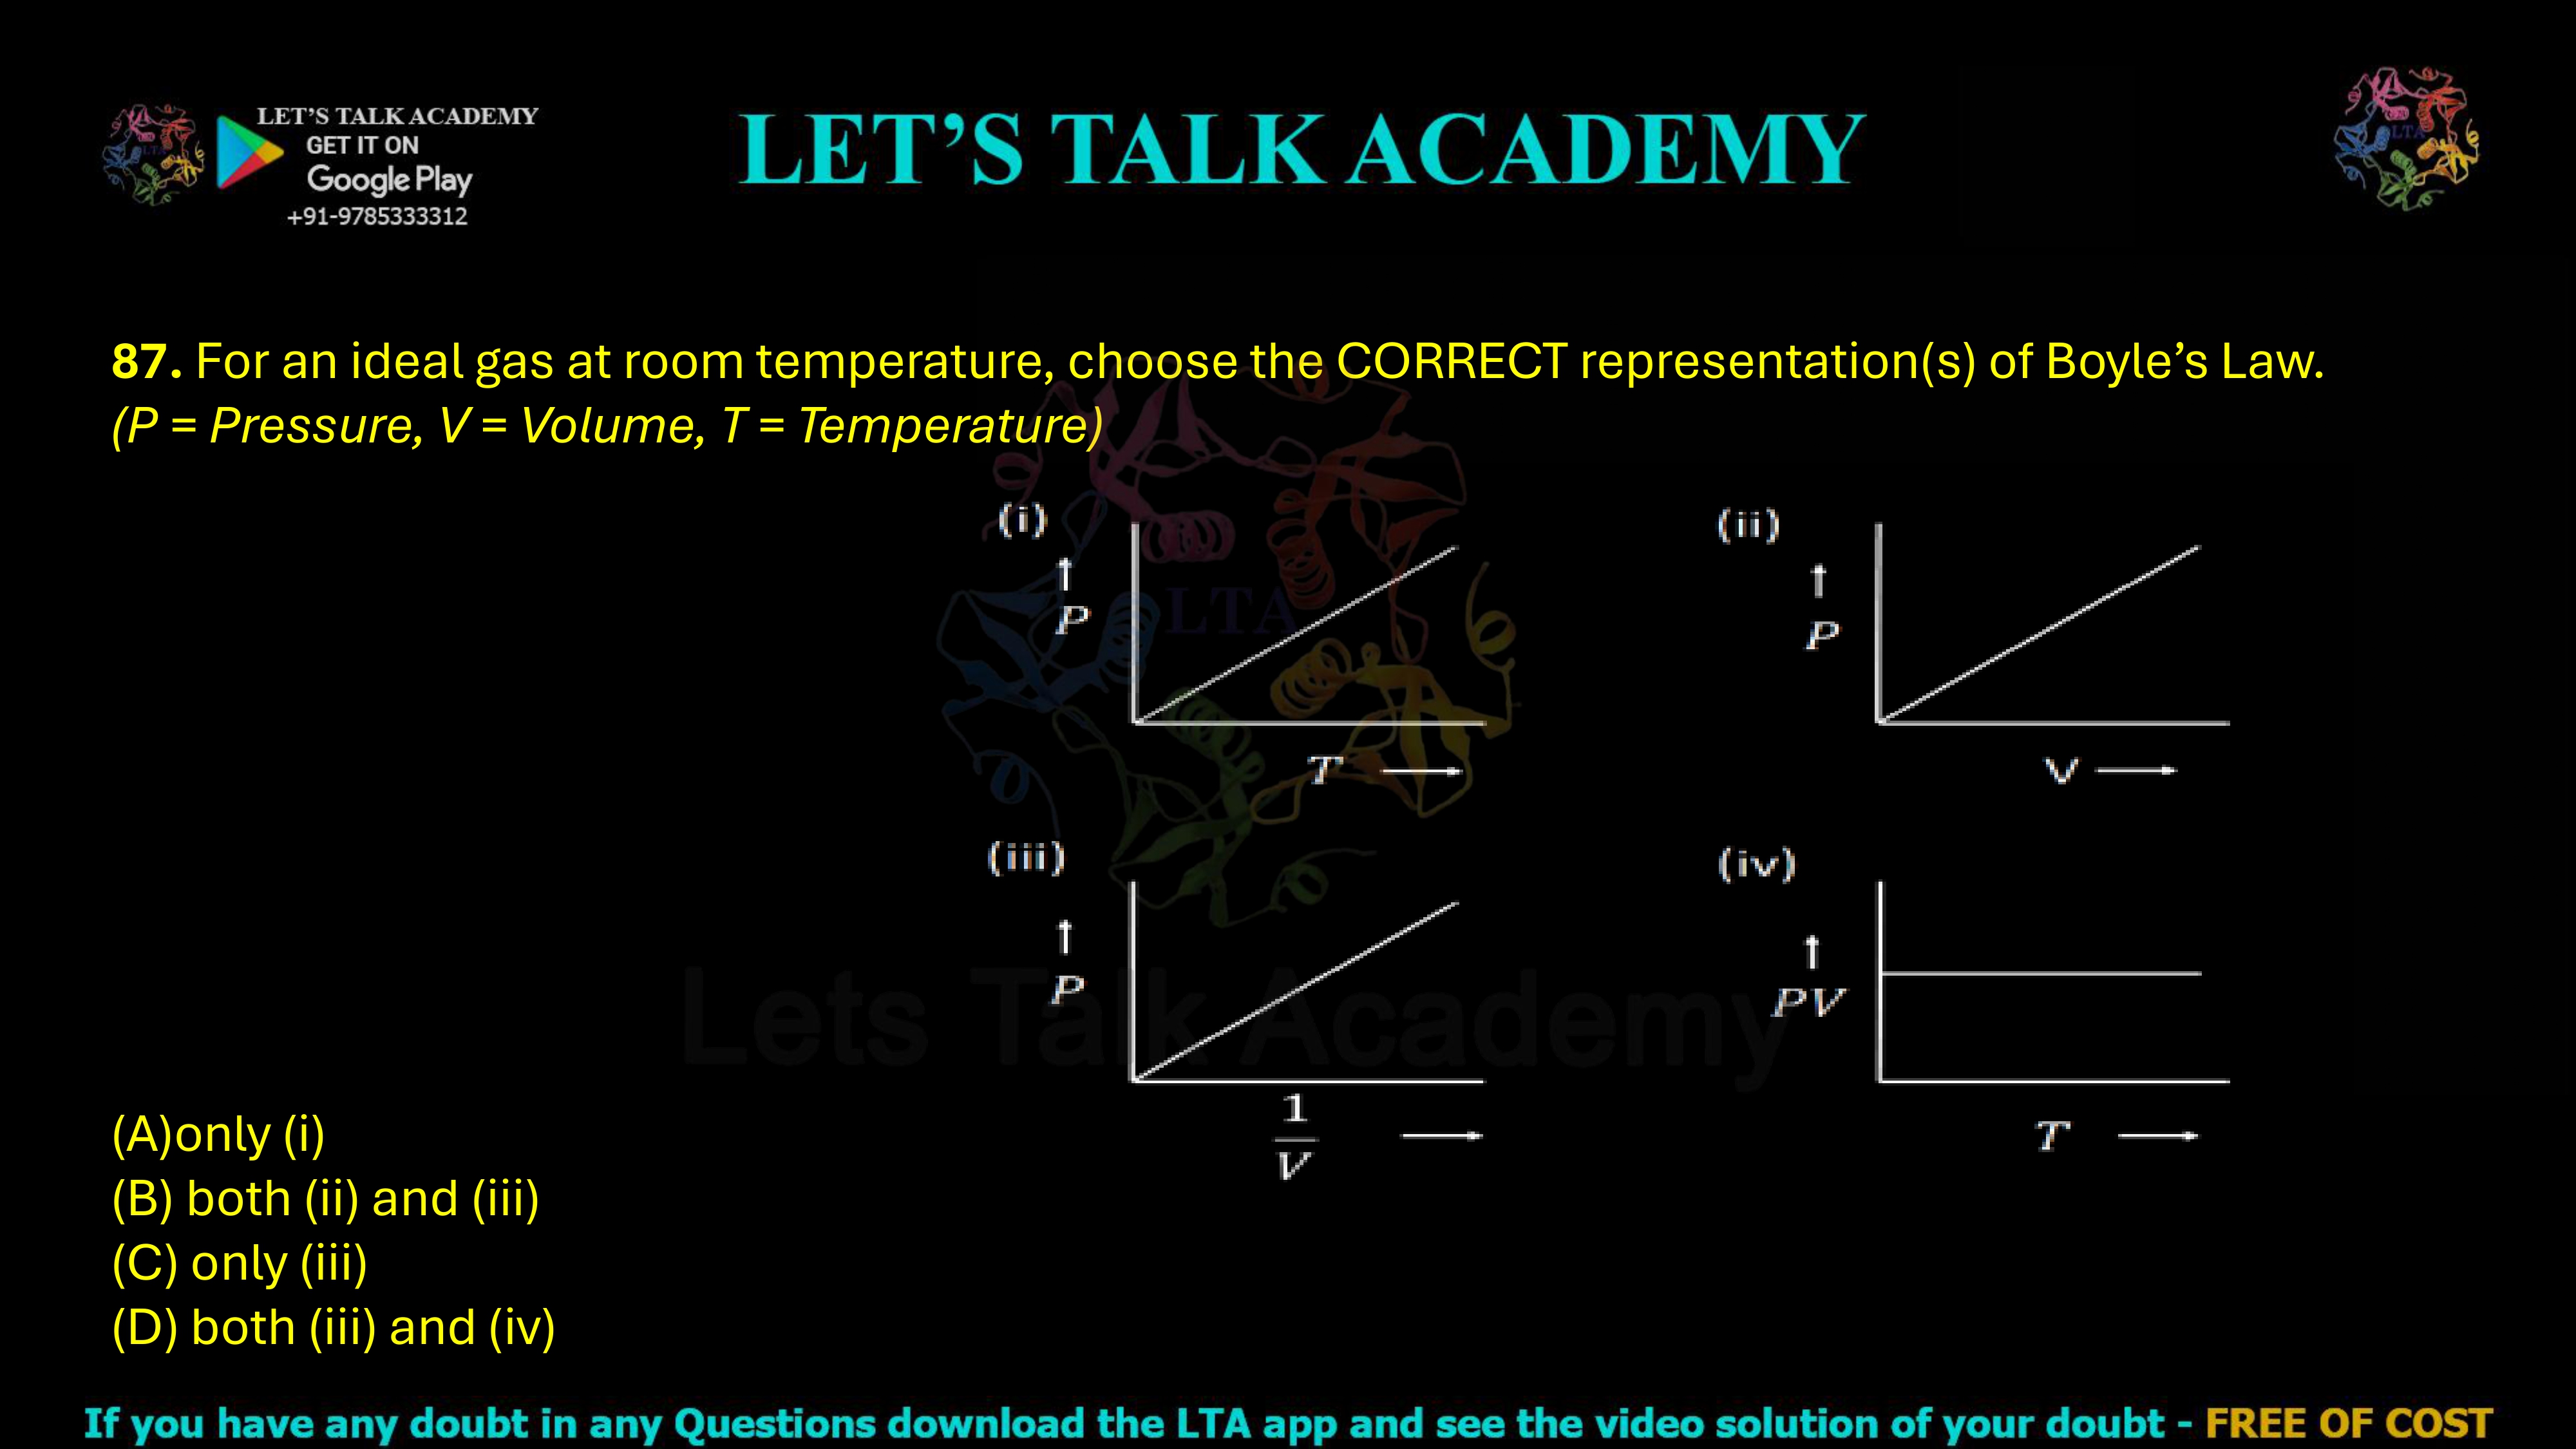
87. For an ideal gas at room temperature, choose the CORRECT representation(s) of Boyle’s Law.
(P = Pressure, V = Volume, T = Temperature)
(A) only (i)
(B) both (ii) and (iii)
(C) only (iii)
(D) both (iii) and (iv)
Boyle’s Law – Complete Theory, Graphical Representation
Correct Answer
(D) Both (iii) and (iv)
What is Boyle’s Law?
Boyle’s Law states that for a fixed mass of an ideal gas kept at constant temperature, the pressure of the gas is inversely proportional to its volume.
Mathematically,
P ∝ 1/V
or
PV = Constant
This means that if the volume decreases, the pressure increases in such a way that the product of pressure and volume always remains constant, provided the temperature does not change.
This law is applicable only under isothermal conditions, meaning the temperature remains constant throughout the process.
Derivation of Boyle’s Law from the Ideal Gas Equation
The ideal gas equation is
PV = nRT
where
- P = Pressure
- V = Volume
- n = Number of moles
- R = Universal gas constant
- T = Absolute temperature
For a fixed quantity of gas, both n and R remain constant.
Since Boyle’s Law is applied at constant temperature, T is also constant.
Therefore,
PV = Constant
or
P ∝ 1/V
This equation is the mathematical statement of Boyle’s Law.
Understanding Each Graph
Graph (i): Pressure (P) versus Temperature (T)
This graph shows pressure increasing linearly with temperature.
This is not Boyle’s Law. It actually represents Gay-Lussac’s Law, which states that pressure is directly proportional to absolute temperature when volume remains constant.
Mathematically,
P ∝ T
Therefore, Graph (i) does not represent Boyle’s Law.
Graph (i) is Incorrect.
Graph (ii): Pressure (P) versus Volume (V)
The graph shown is a straight line with positive slope.
According to Boyle’s Law, pressure and volume are inversely proportional.
The correct P–V graph should be a rectangular hyperbola, not a straight line.
As volume increases, pressure must decrease.
Therefore, the graph shown does not satisfy Boyle’s Law.
Graph (ii) is Incorrect.
Graph (iii): Pressure (P) versus 1/V
Boyle’s Law states
P ∝ 1/V
This means pressure is directly proportional to the reciprocal of volume.
Whenever two quantities are directly proportional, their graph is a straight line passing through the origin.
Since the graph shows pressure plotted against 1/V and is a straight line through the origin, it perfectly represents Boyle’s Law.
Graph (iii) is Correct.
Graph (iv): Product PV versus Temperature (T)
According to Boyle’s Law,
PV = Constant
During an isothermal process, the temperature remains fixed and the product PV does not change.
Therefore, the graph of PV is represented as a horizontal line, indicating a constant value.
This is exactly what is shown in graph (iv).
Graph (iv) is Correct.
Detailed Option-Wise Analysis
Option (A): Only (i)
This option is incorrect because graph (i) represents the relationship between pressure and temperature, which corresponds to Gay-Lussac’s Law rather than Boyle’s Law.
Option (B): Both (ii) and (iii)
Although graph (iii) is correct, graph (ii) is incorrect because the pressure-volume graph for Boyle’s Law is not a straight line but a rectangular hyperbola.
Option (C): Only (iii)
Graph (iii) certainly represents Boyle’s Law correctly. However, graph (iv) is also a valid representation because the product PV remains constant during an isothermal process.
Therefore, this option is incomplete.
Option (D): Both (iii) and (iv)
Graph (iii) correctly shows that pressure is directly proportional to the reciprocal of volume.
Graph (iv) correctly represents the constant value of PV during an isothermal process.
Hence, both graphs accurately represent Boyle’s Law.
Option (D) is Correct.
Physical Interpretation of Boyle’s Law
Imagine a gas enclosed inside a cylinder fitted with a movable piston. If the piston is pushed inward, the available volume decreases. Since the gas molecules now have less space to move, they collide with the walls more frequently. This increased collision rate produces a higher pressure.
Conversely, if the piston is pulled outward, the gas occupies a larger volume. The molecules become more spread out, collisions with the walls decrease, and the pressure falls.
This microscopic explanation perfectly agrees with Boyle’s Law.
Real-Life Applications of Boyle’s Law
Boyle’s Law has numerous practical applications in daily life and engineering. It explains the working of syringes, bicycle pumps, air compressors, scuba diving equipment, respiratory systems, pneumatic machines, and many industrial gas storage systems. Understanding Boyle’s Law is also essential in medicine, aviation, and chemical engineering.
Exam-Oriented Key Concepts
Students should remember that Boyle’s Law is valid only for a fixed mass of gas at constant temperature. The P–V graph is always a rectangular hyperbola, while the P versus 1/V graph is a straight line passing through the origin. The product PV remains constant throughout the process. Questions involving these graphical representations are among the most frequently asked conceptual questions in competitive examinations.
Final Answer
The correct graphical representations of Boyle’s Law are graph (iii), which shows pressure directly proportional to the reciprocal of volume, and graph (iv), which shows the product PV remaining constant.
Correct Option: (D) Both (iii) and (iv)


