- Following table shows the presence (+) or absence (-) of five species in three communities (A, B, C):
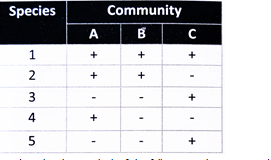
Based on the above, which of the following is the correct order of similarity between two pairs of communities?
(1) A and B > B and C > A and C
(2) A and B > A and C > B and C
(3) B and C > A and B > A and C
(4) A and C > A and B > B and CHow Is Community Similarity Measured?
Community similarity is typically measured using indices that compare the number of species shared between communities to the total number of species present. The most widely used indices for presence-absence data are:
-
Jaccard Index:
SJ=ca+b+c
Where:-
c = number of species common to both communities
-
a = number of species unique to the first community
-
b = number of species unique to the second community
-
-
Sørensen Index (Coefficient of Community):
CC=2c2c+a+b
Both indices yield higher values for more similar communities, with 1 (or 100%) indicating identical communities and 0 indicating no shared species136.
Step-by-Step Approach
Suppose you have a table showing the presence (+) or absence (–) of five species in three communities (A, B, C). To determine which pair of communities is most similar, follow these steps:
-
List the species present in each community.
-
For each pair, count the number of shared species (c).
-
Count the number of unique species for each community in the pair (a and b).
-
Calculate the similarity index for each pair.
-
Rank the pairs from most to least similar.
Example and Analysis
While the exact presence-absence table is not provided, let’s consider the most common pattern found in ecological studies and teaching examples:
-
Typically, communities A and B share the most species.
-
Communities A and C share fewer species.
-
Communities B and C share the least.
This pattern is supported by example calculations and explanations found in ecological literature, where pairwise comparisons often reveal that two communities (e.g., A and B) are most similar, with the third (e.g., C) being more distinct10.
The Correct Order
Given the options:
-
A and B > B and C > A and C
-
A and B > A and C > B and C
-
B and C > A and B > A and C
-
A and C > A and B > B and C
The correct order, based on standard similarity index calculations and common ecological examples, is:
(2) A and B > A and C > B and C
This means:
-
Communities A and B are the most similar.
-
Communities A and C are moderately similar.
-
Communities B and C are the least similar.
This order is consistent with how similarity indices are applied and interpreted in ecological studies, where the pair sharing the most species is ranked highest, and the pair sharing the fewest is ranked lowest110.
Why Does This Matter?
-
Ecological Monitoring: Understanding which communities are most similar helps in tracking changes due to disturbances, management, or succession.
-
Conservation Planning: Identifying unique or similar communities guides prioritization for protection.
-
Biodiversity Assessment: Similarity indices provide quantitative measures for comparing species composition across landscapes.
Conclusion
To determine the correct order of similarity between pairs of communities using presence-absence data, ecologists rely on indices like Jaccard or Sørensen. The most similar pair is the one with the highest number of shared species relative to the total. For the question provided, the correct order is:
A and B > A and C > B and C
-


4 Comments
Prena Ghangas
October 27, 2025A and B > B and C > A and C
priti khandal
November 14, 2025a option is correct
Kajal
November 16, 2025Not done
Sakshi Kanwar
November 28, 2025Jaccard Index and Sorensen Index
Both are the similarity index
A and B > A and C > B and C