Germplasm theory was proposed by- (1) Dobszzhanky (2) Weismann (3) Meyer (4) Mendel Introduction The study of heredity has undergone remarkable transformations over the centuries. One of the most pivotal […]

Germplasm theory was proposed by- (1) Dobszzhanky (2) Weismann (3) Meyer (4) Mendel Introduction The study of heredity has undergone remarkable transformations over the centuries. One of the most pivotal […]

In the cladograms given below each nucleotide change is indicated by a black bar Which one of the following options represents two equally most parsimonious trees? (1) A and B […]

The repeated evolution of a specific trait or body plan from the same ancestor lineage but at different times is termed as (1) Iterative evolution (2) Convergent evolution (3) Coevolution […]

The Cuvier’s theory, which states that there had been several creations, each preceded by another due to some large scale geographical disturbances. Such theory is termed as- (1) Theory of […]
Rarely there is occurrence of gill clefts in higher animals. The reason for this rare appearance is (1) They may be useful for that organism (2) Ancestral returns of that […]

When James R Brown and W Ford Doolittle (1997) reconstructed the tree of life using a variety of different genes, they found that different genes gave fundamentally different phylogenies as […]

In the phylogenetic tree above, branch-lengths are drawn proportional to the number of changes along a lineage. The following inferences were made from this tree. (A) Bacteria are more closely […]

Early embryonic stages of pig and mouse are almost identical, it reveals- (1) Common ancestry (2) Progressive evolution (3) Directional Evolution (4) Homoplasy Introduction The early stages of embryonic development […]
In an experiment bacterial cell wall was removed usingenzymatic methods. It was observed that on culturingsuch cell wall deficient bacteria, for many generations result into stable forms of bacteria permanently lacking cell […]
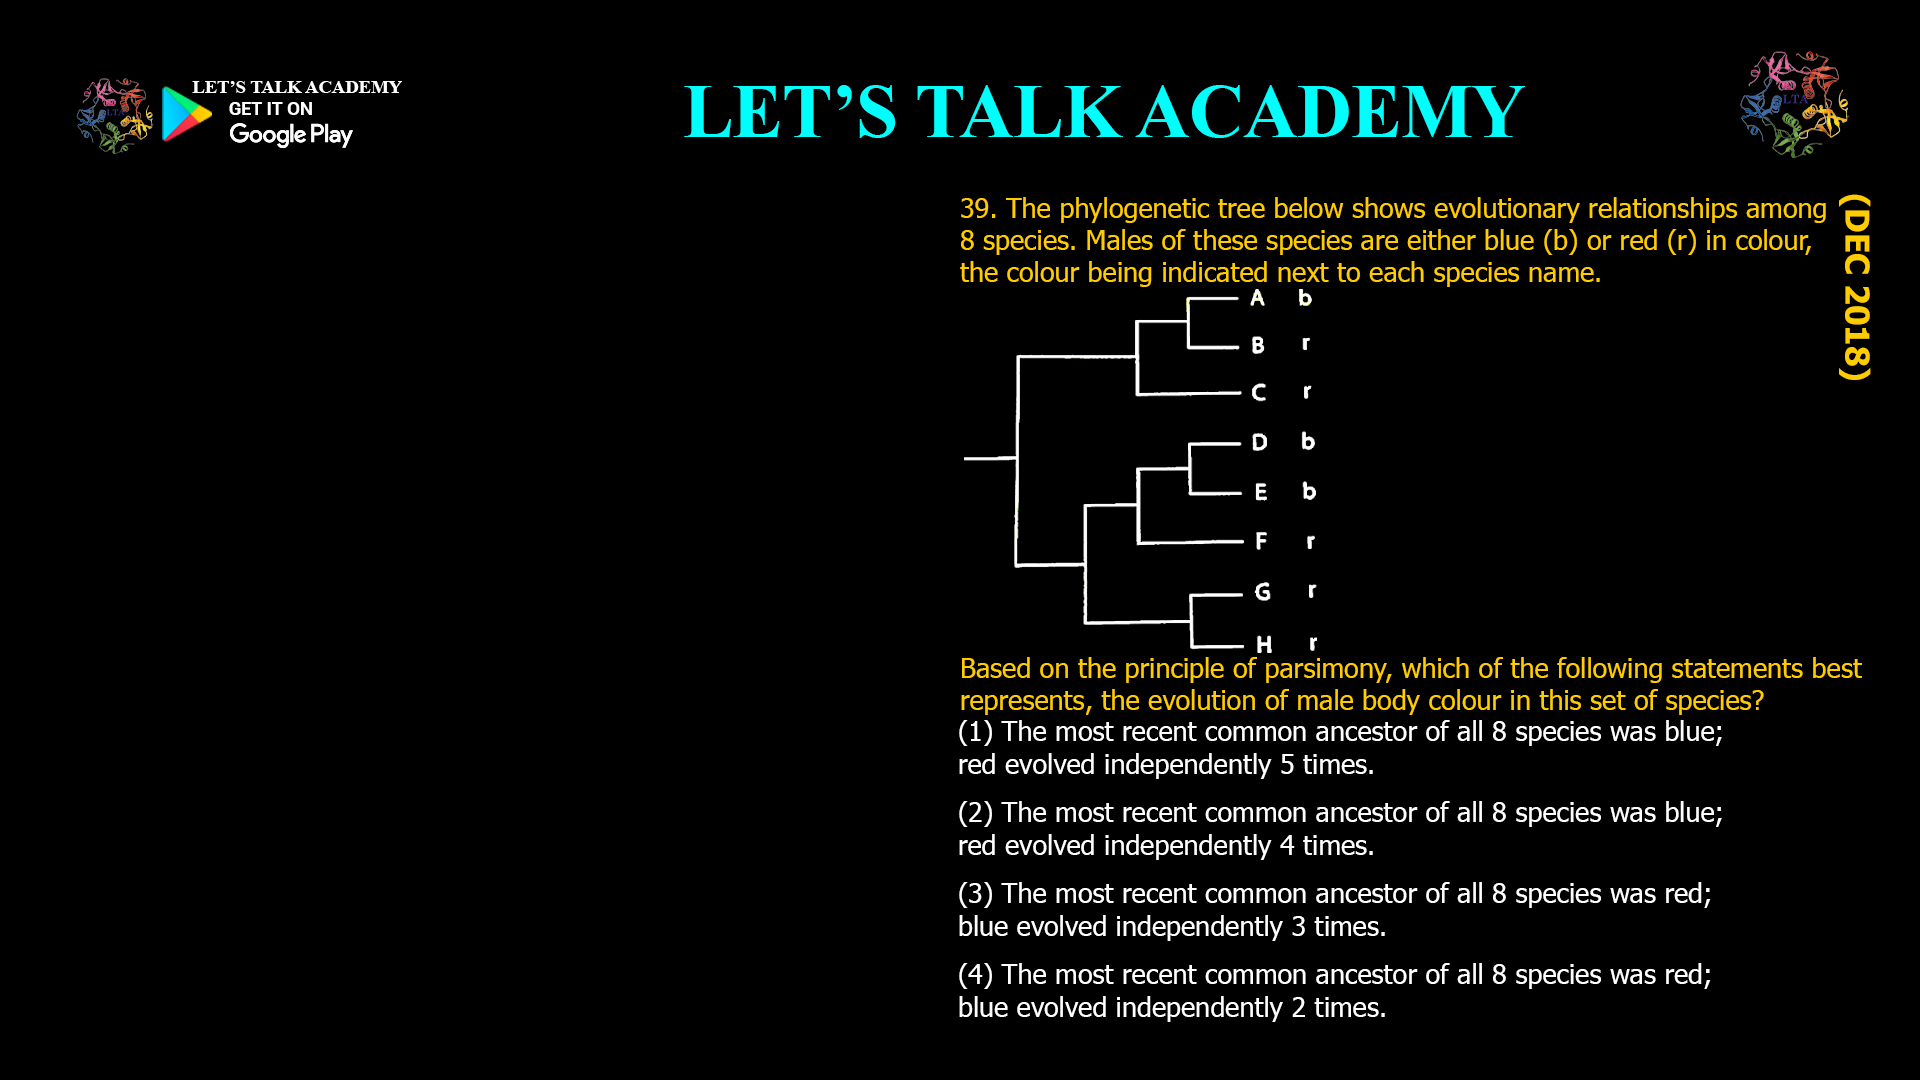
The phylogenetic tree below shows evolutionary relationships among 8 species. Males of these species are either blue (b) or red (r) in colour, the colour being indicated next to each […]


