- Following table shows the number of individuals of different species in two communities, X and Y.
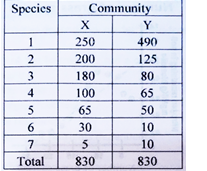
Based on the above data and the Simpson’s Diversity Index which one of the following
statements is true?
(1) X has greater alpha diversity than Y
(2) Y has greater alpha diversity than X
(3) X and Y have equal alpha diversities
(4) X has greater species richness than YUnderstanding biodiversity within ecological communities is crucial for conservation and ecological research. Alpha diversity, a key concept in ecology, refers to the diversity within a particular area or ecosystem and is commonly measured using indices that account for both species richness and evenness. One of the most widely used metrics for this purpose is Simpson’s Diversity Index. This article explains how Simpson’s Index works and reveals which community—X or Y—has greater alpha diversity based on this measure.
What is Simpson’s Diversity Index?
Simpson’s Diversity Index (D) is a mathematical measure that reflects how likely it is that two individuals randomly selected from a sample will belong to different species. The formula is:
D=∑i=1S(niN)2
-
ni = number of individuals of species i
-
N = total number of individuals of all species
-
S = total number of species
The value of D ranges from 0 to 1:
-
0 means infinite diversity (all species are equally abundant)
-
1 means no diversity (only one species present)
However, for intuitive interpretation, ecologists often use Simpson’s Diversity Index of Diversity (1−D), where higher values indicate greater diversity1346.
Alpha Diversity: More Than Just Species Richness
Alpha diversity measures both:
-
Species richness (the number of species present)
-
Species evenness (how evenly individuals are distributed among those species)
A community with many species and a balanced distribution of individuals will have a higher alpha diversity than one dominated by a single species, even if both have the same number of species25.
Calculating and Comparing Alpha Diversity
Suppose you have the following data for two communities, X and Y:
Species Community X Community Y 1 10 18 2 10 1 3 10 1 4 10 1 5 10 1 -
Community X: All species have equal abundance (10 individuals each).
-
Community Y: One species (Species 1) dominates, others are rare.
Step 1: Calculate Proportions
-
Community X: Each species = 10/50 = 0.2
-
Community Y: Species 1 = 18/22 ≈ 0.818; others = 1/22 ≈ 0.045
Step 2: Apply Simpson’s Formula
Community X
DX=5×(0.2)2=5×0.04=0.201−DX=1−0.20=0.80
Community Y
DY=(0.818)2+4×(0.045)2≈0.669+4×0.002=0.669+0.008=0.6771−DY=1−0.677=0.323
Step 3: Interpret the Results
-
Community X: 1−DX=0.80 (higher diversity)
-
Community Y: 1−DY=0.323 (lower diversity)
Community X, with its even distribution of individuals, has much higher alpha diversity than Community Y, which is dominated by a single species.
Species Richness vs. Diversity
-
Species richness is simply the count of species. In the example above, both communities have five species.
-
Alpha diversity (as measured by Simpson’s Index) incorporates both richness and evenness, making it a more comprehensive measure of biodiversity45.
Which Statement is True?
Given the options:
-
X has greater alpha diversity than Y
-
Y has greater alpha diversity than X
-
X and Y have equal alpha diversities
-
X has greater species richness than Y
The correct answer is:
(1) X has greater alpha diversity than Y
This is because Community X has both high species richness and evenness, while Community Y is dominated by one species, reducing its overall diversity1346.
Why Does This Matter?
-
Conservation: Understanding which communities are more diverse helps prioritize areas for protection.
-
Ecological Health: High alpha diversity often indicates a resilient and stable ecosystem.
-
Resource Management: Managing for both richness and evenness can sustain ecosystem services.
Conclusion
Simpson’s Diversity Index is a powerful tool for comparing the alpha diversity of ecological communities. It highlights the importance of both the number of species and their relative abundances. In our example, Community X, with a more even distribution of individuals among species, is more diverse than Community Y, which is dominated by a single species. Thus, when using Simpson’s Index, always consider both richness and evenness to get a true picture of biodiversity.
-


5 Comments
Prena Ghangas
October 27, 2025Alpha diversity index of community X is 0.7 and of y is 0.61 and Alpha diversity of x community is high
Manisha choudhary
November 6, 2025Community x m evenness more h
X has greater alpha diversity
priti khandal
November 14, 2025x has greater alpha diversity
Kajal
November 16, 2025Community X is more even so has more alpha diversity
Sakshi Kanwar
November 28, 2025X has greater alpha diversity than Y
Community X has both high species richness and evenness