Which of these programs is used to conserve a species facing extinction? (1) Captive breeding. (2) Natural resources (3) Sustainable use. (4) Edge effect The rapid loss of biodiversity is […]
Which of these programs is used to conserve a species facing extinction? (1) Captive breeding. (2) Natural resources (3) Sustainable use. (4) Edge effect The rapid loss of biodiversity is […]
Wetlands are conserved internationally through an,effort called as (1) Basel Convention (2) Rio Convention (3) Montreal Convention (4) Ramsar Convention What is the Ramsar Convention? The Ramsar Convention, officially known […]

The curve shown below shows a relationship between (1) Time (X) and Population density (Y) (2) Body size (X) and generation time (Y) (3) Generation time (X) and intrinsic rate […]

Among the following which combination shows positive relationship? (1) Generation time and animal size (2) Generation time and intrinsic rate of growth (3) Animal size and number of offspring (4) […]
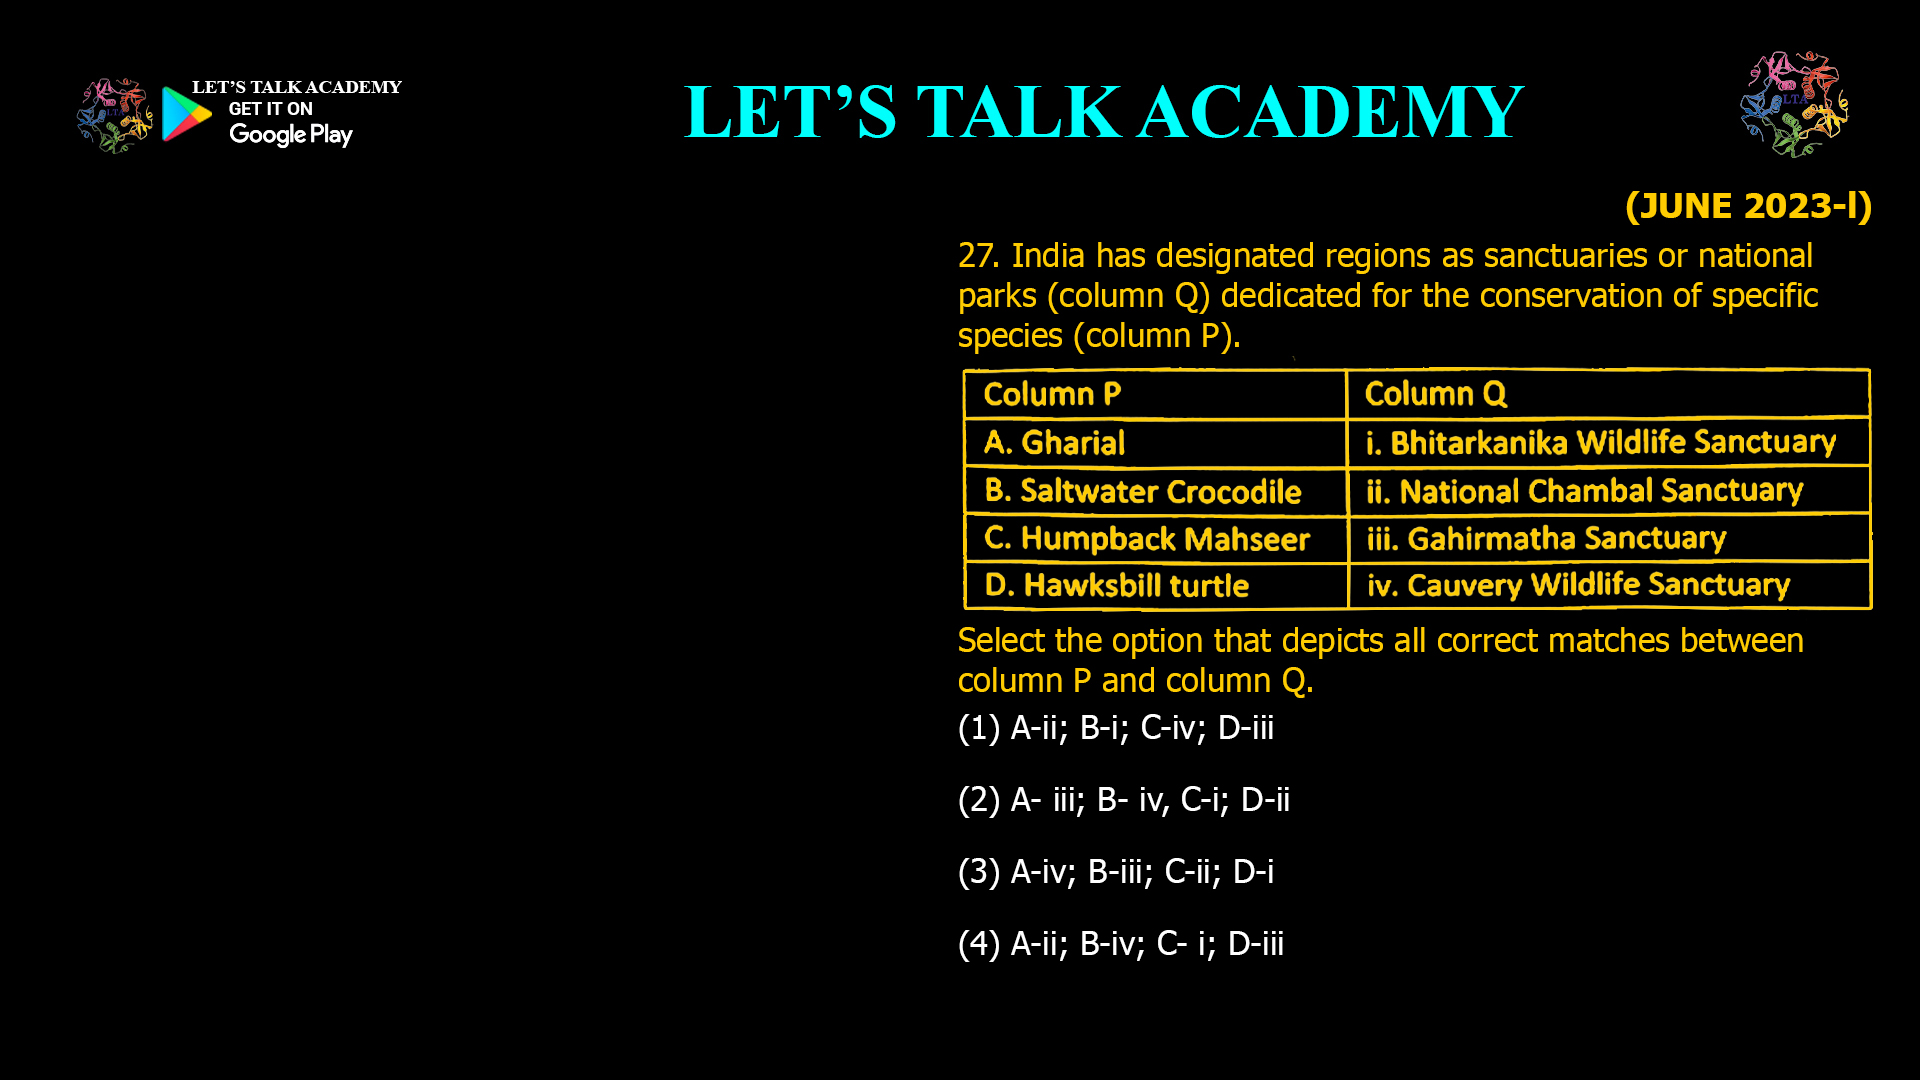
India has designated regions as sanctuaries or national parks (column Q) dedicated for the conservation of specific species (column P). Select the option that depicts all correct matches between column […]

The three graphs (A, B, C) show population growth (N) patterns in relation to N or time (t) Which of the following is correct with reference to the Y-axis label […]

Which of the following represents exponential growth in populations? What is Exponential Growth in Populations? Exponential growth describes how a population increases rapidly when resources are unlimited and environmental […]

Consider the following graphs for per capita growth rate () ()as a function of population density (N). Which one of the plots correctly depicts strong Allee effect in a population? […]

The following graph is for a logistically growing population, with Ntplotted on the X-axis. What is the parameter plotted on the Y-axis? (1) dN/dt (2) Nt+1 (3) dN/dt. 1/N (4) […]

Which of the following curves represents the generalrelationship between population size (N) and growthrate (dN/dt) for logistically growing population?v Introduction Population growth is a fundamental concept in ecology, and understanding […]


