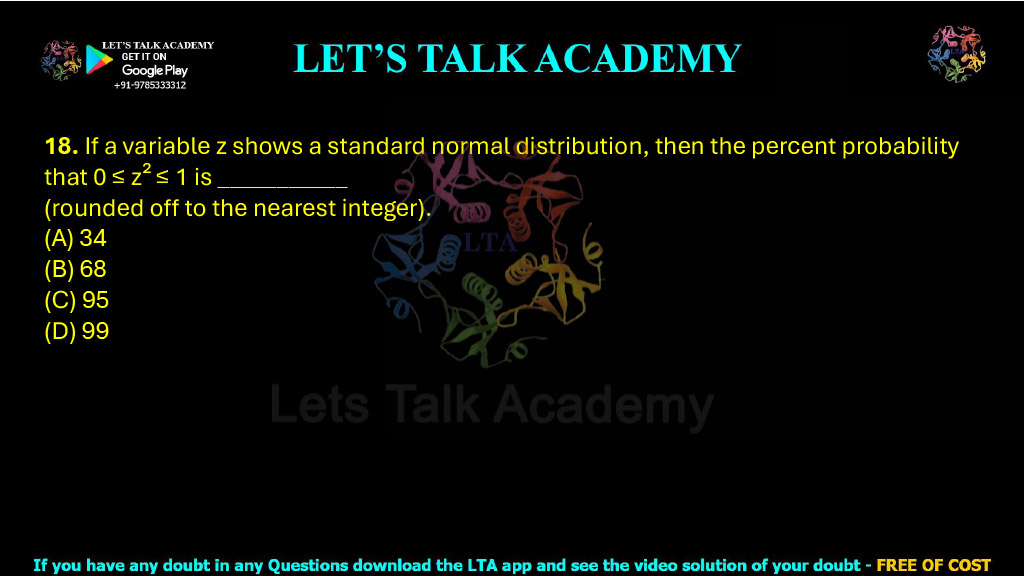
(A) 34
(B) 68
(C) 95
(D) 99
Percent Probability That 0 ≤ Z ≤ 1 in a Standard Normal Distribution
Understanding the Standard Normal Distribution Problem
This question asks us to calculate the percentage probability that a standard normal random variable Z lies between 0 and 1. The standard normal distribution is one of the most important probability distributions in statistics and is represented by a symmetric bell-shaped curve centered at zero.
The required probability is:
P(0 ≤ Z ≤ 1)
Here, Z = 0 represents the mean of the standard normal distribution, while Z = 1 represents a point exactly one standard deviation above the mean. Therefore, the question asks for the area under the standard normal curve between the mean and one standard deviation above the mean.
The required probability is approximately 0.3413. When converted into a percentage, this becomes 34.13%, which rounds to 34% to the nearest integer. Therefore, the correct answer is Option (A).
What Is a Standard Normal Distribution?
A standard normal distribution is a special normal distribution with a mean of 0 and a standard deviation of 1. It is commonly represented using the random variable Z.
For a standard normal distribution:
Mean, μ = 0
and
Standard deviation, σ = 1
The distribution is perfectly symmetric about Z = 0. Therefore, exactly half of the total probability lies to the left of zero and the other half lies to the right of zero.
Mathematically:
P(Z ≤ 0) = 0.5
and
P(Z ≥ 0) = 0.5
The total area under the complete standard normal curve is equal to 1, or 100% when expressed as a percentage.
Step-by-Step Solution
Step 1: Identify the Required Probability
The question asks for the probability:
P(0 ≤ Z ≤ 1)
This means that we need to calculate the area under the standard normal curve starting from Z = 0 and ending at Z = 1.
The value Z = 0 is located at the center of the distribution because the mean of a standard normal distribution is zero. The value Z = 1 lies one standard deviation to the right of the mean.
Step 2: Use the Standard Normal Distribution Table
A standard normal distribution table, commonly called a Z-table, provides cumulative probabilities associated with different Z-values. For Z = 1.00, the cumulative probability is:
P(Z ≤ 1) = 0.8413
This means that approximately 84.13% of the total area under the standard normal curve lies to the left of Z = 1.
At Z = 0, symmetry of the standard normal distribution gives:
P(Z ≤ 0) = 0.5000
Step 3: Calculate the Probability Between Z = 0 and Z = 1
To find the probability between Z = 0 and Z = 1, subtract the cumulative probability up to Z = 0 from the cumulative probability up to Z = 1:
P(0 ≤ Z ≤ 1) = P(Z ≤ 1) − P(Z ≤ 0)
Substituting the standard normal probabilities:
P(0 ≤ Z ≤ 1) = 0.8413 − 0.5000
Therefore:
P(0 ≤ Z ≤ 1) = 0.3413
Step 4: Convert the Probability into a Percentage
The question asks for the percent probability. Therefore, we multiply the decimal probability by 100:
Percentage probability = 0.3413 × 100
Thus:
Percentage probability = 34.13%
The question asks for the answer rounded off to the nearest integer. Therefore:
34.13% ≈ 34%
Hence, the required answer is:
34
Alternative Solution Using the 68–95–99.7 Rule
The answer can also be understood using the empirical rule for a normal distribution. According to the 68–95–99.7 rule, approximately 68% of the total observations in a normal distribution lie within one standard deviation of the mean.
Therefore:
P(−1 ≤ Z ≤ 1) ≈ 68%
The standard normal distribution is symmetric about Z = 0. Hence, the area from Z = −1 to Z = 0 is equal to the area from Z = 0 to Z = 1.
Therefore:
P(0 ≤ Z ≤ 1) ≈ 68% / 2
Thus:
P(0 ≤ Z ≤ 1) ≈ 34%
This gives the same answer as the more precise Z-table method.
Why the Required Probability Is 34% and Not 68%
The value 68% represents the approximate probability of a normally distributed variable lying between one standard deviation below the mean and one standard deviation above the mean. In terms of the standard normal variable, this interval is:
−1 ≤ Z ≤ 1
However, the question asks only for:
0 ≤ Z ≤ 1
This interval covers only the right half of the region between Z = −1 and Z = 1. Since the normal distribution is symmetric, half of 68% is approximately 34%.
Detailed Analysis of Each Option
Option (A): 34
This option is correct. The probability between Z = 0 and Z = 1 is 0.3413. Converting this value into a percentage gives 34.13%, which becomes 34% when rounded to the nearest integer.
Option (B): 68
This option is incorrect for the given interval. Approximately 68% of a normal distribution lies between Z = −1 and Z = 1. The question asks only for the interval from Z = 0 to Z = 1, which represents approximately half of this area.
Option (C): 95
This option is incorrect. Approximately 95% of observations in a normal distribution lie within two standard deviations of the mean, corresponding approximately to the interval −2 ≤ Z ≤ 2. This is much wider than the interval given in the question.
Option (D): 99
This option is incorrect. Approximately 99.7% of a normal distribution lies within three standard deviations of the mean, corresponding to the interval −3 ≤ Z ≤ 3. Therefore, 99% cannot represent the much smaller interval between Z = 0 and Z = 1.
Understanding the Area Under the Standard Normal Curve
The complete area under the standard normal curve represents the total probability and is equal to 1, or 100%. Because the curve is symmetric about zero, each half of the distribution contains 50% of the total probability.
The interval from Z = 0 to Z = 1 contains approximately 34.13% of the total probability. Similarly, the interval from Z = −1 to Z = 0 also contains approximately 34.13%.
Therefore, combining these two equal regions gives:
34.13% + 34.13% = 68.26%
This is the more precise probability associated with the interval −1 ≤ Z ≤ 1 and explains the familiar approximation of 68% used in the empirical rule.
Final Answer
The percent probability that 0 ≤ Z ≤ 1 in a standard normal distribution is approximately 34% when rounded off to the nearest integer.
Correct Option: (A) 34


