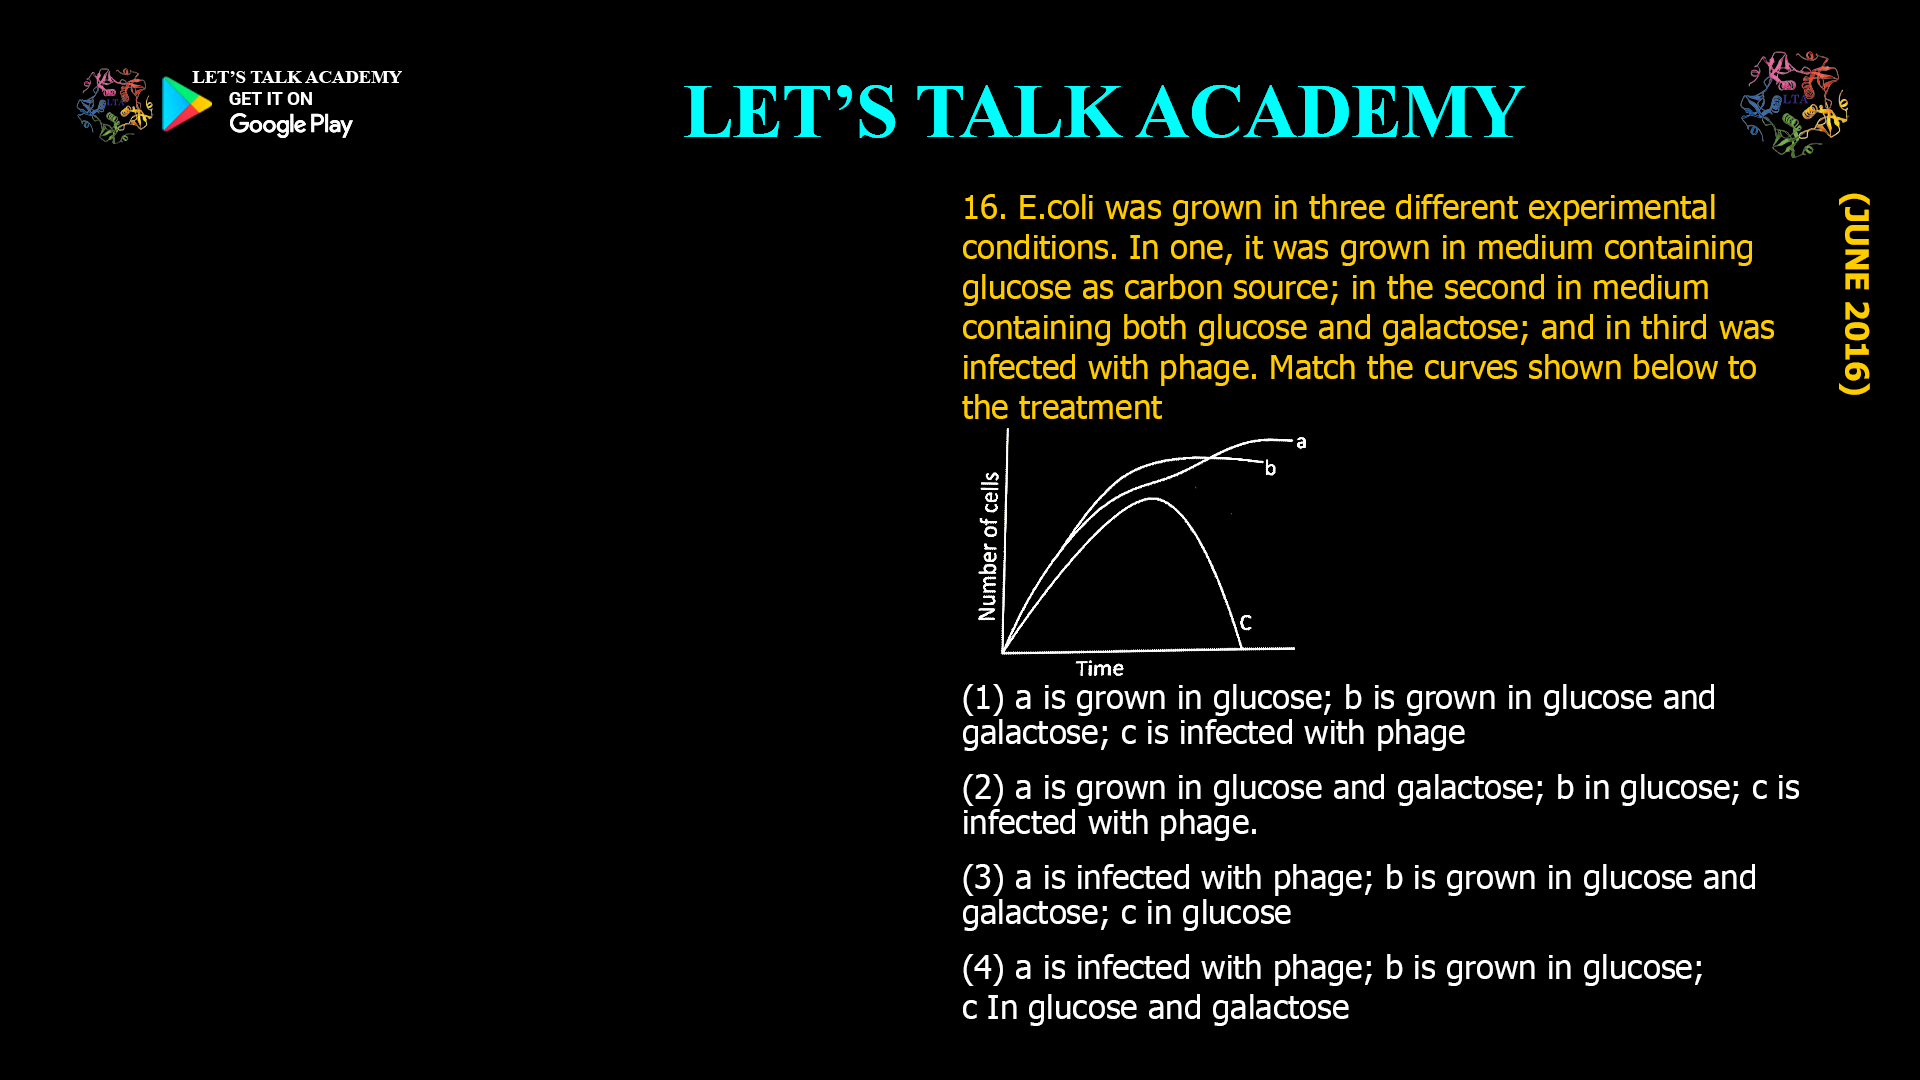
16. E.coli was grown in three different experimental conditions. In one, it was grown in medium Containing as carbon source; in the second in medium containing both glucose and galactose; and third was
infected With phage. Match the curves shown below to the treatment
(1) a is grown in glucose; b is grown in glucose and galactose; c is infected with phage
(2) a is grown in glucose and galactose; b in glucose; c is infected with phage.
(3) a is infected with phage; b is grown in glucose and galactose; c in glucose
(4) a is infected with phage; b is grown in glucose; c In glucose and galactose
Understanding bacterial growth dynamics under different conditions is fundamental in microbiology. Escherichia coli exhibits distinct growth patterns depending on carbon source availability or external stressors like phage infection. This article analyzes three growth curves corresponding to E. coli grown in glucose, glucose-galactose, and phage-infected cultures, explaining the biological basis for each curve and identifying the correct match.
Key Growth Patterns in E. coli
1. Growth in Glucose (Single Carbon Source)
-
Exponential Phase: E. coli grows rapidly by fermenting glucose, producing a steep upward curve.
-
Stationary Phase: Growth halts once glucose is depleted, resulting in a plateau.
-
Curve Shape: A single sigmoidal curve without intermediate lag phases.
2. Growth in Glucose + Galactose (Diauxic Growth)
-
First Exponential Phase: Glucose is preferentially metabolized, leading to rapid growth.
-
Lag Phase: A brief pause as glucose is exhausted and cells induce galactose utilization genes.
-
Second Exponential Phase: Growth resumes using galactose, but at a slower rate.
-
Curve Shape: Two exponential phases separated by a lag phase (diauxic curve).
3. Growth During Phage Infection
-
Initial Growth Phase: Bacteria multiply until phage particles outnumber host cells.
-
Lysis Phase: Phage-induced cell lysis causes a sharp decline in optical density (OD).
-
Recovery Phase (if resistant mutants exist): Surviving phage-resistant cells regrow, forming a second, smaller exponential phase.
-
Curve Shape: Initial rise → sharp drop → gradual rise (if resistant mutants are present).
Matching Growth Curves to Conditions
Assuming the curves are labeled a, b, and c as follows:
-
Curve a: Single exponential phase (glucose alone).
-
Curve b: Two exponential phases with a lag (glucose + galactose).
-
Curve c: Initial rise, sharp drop, and partial recovery (phage infection).
Correct Match:
(1) a is grown in glucose; b is grown in glucose and galactose; c is infected with phage.
Biological Explanation of Each Curve
Curve a (Glucose Alone)
-
E. coli consumes glucose efficiently via glycolysis.
-
No lag phase between growth phases because only one carbon source is present.
-
Growth stops abruptly when glucose is exhausted.
Curve b (Glucose + Galactose)
-
Catabolite Repression: Glucose suppresses galactose utilization genes.
-
Diauxic Shift: After glucose depletion, a lag phase occurs as cells synthesize galactose-metabolizing enzymes (e.g., galactokinase).
-
Slower growth resumes on galactose due to less efficient energy yield.
Curve c (Phage Infection)
-
Lytic Cycle: Phages infect and lyse E. coli, reducing OD.
-
Resistant Mutants: A subpopulation survives due to spontaneous mutations (e.g., receptor modifications).
-
Regrowth: Resistant cells proliferate, causing a second growth phase.
Why Other Options Are Incorrect
-
Option 2: Suggests glucose + galactose has a single phase (incorrect; diauxic growth requires two phases).
-
Option 3/4: Phage infection curves lack the characteristic dip-and-rise pattern if placed as “a” or “c” incorrectly.
Conclusion
The growth curves of E. coli under these conditions reflect its metabolic priorities and stress responses. Glucose supports rapid, unimpeded growth; glucose-galactose induces diauxic shifts; and phage infection causes population collapse followed by mutant-driven recovery. The correct match is Option 1, aligning each curve with its respective experimental treatment.
Keywords: E. coli growth curves, diauxic growth, glucose metabolism, galactose utilization, phage infection, lytic cycle, catabolite repression, optical density, bacterial lysis, resistant mutants.


14 Comments
Suman bhakar
June 12, 2025Done sir 👍
Arushi
June 15, 2025👍✅
Kajal
November 3, 2025Option 1 is correct
Kirti Agarwal
November 4, 2025Opt 1
Roopal Sharma
November 6, 2025Option 2 is correct
Sonal Nagar
November 6, 2025Option 1st
Soniya Shekhawat
November 6, 2025Option 2nd is correct.
Neeraj Sharma
November 6, 2025Option 2 is correct
Dipti Sharma
November 7, 2025Option 2nd
Neelam Sharma
November 7, 2025Option 1
Anurag Giri
November 9, 2025Option 2
Mohd juber Ali
November 9, 2025Curv a glucose
Curv b glu+ galactose
Curv c infected phase
Sakshi Kanwar
November 11, 2025a is grown in glucose; b is grown in glucose and galactose; c is infected with phage
Manisha choudhary
November 12, 2025Option 2 is correct answer