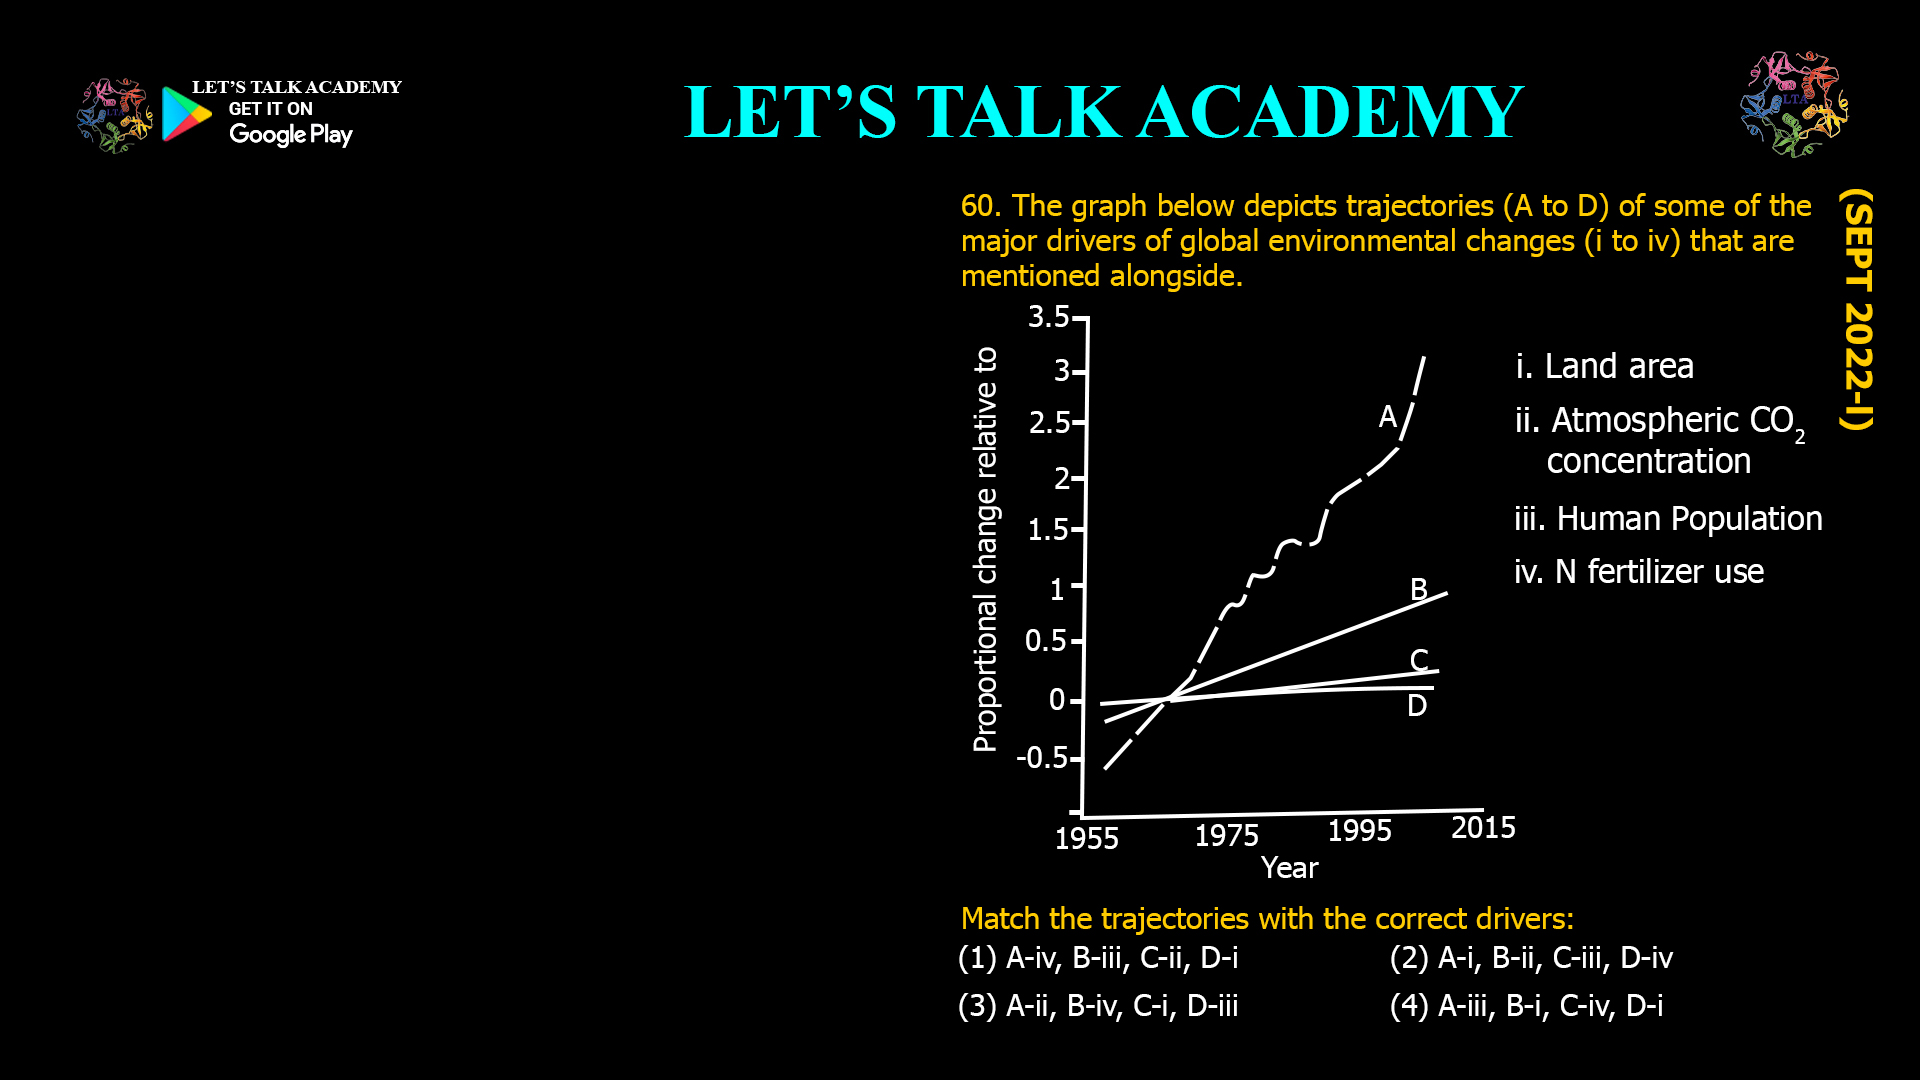
- The graph below depicts trajectories (A to D) of some of the major drivers of global environmental changes (i to iv) that are mentioned alongside.
Match the trajectories with the correct drivers:
(1) A-iv, B-iii, C-ii, D-i (2) A-i, B-ii, C-iii, D-iv
(3) A-ii, B-iv, C-i, D-iii (4) A-iii, B-i, C-iv, D-i
Understanding the Major Drivers of Global Environmental Change
Before matching trajectories to drivers, it is essential to clarify what each major driver represents and how its impact has evolved over time.
1. Climate Change (i)
-
Description: The warming of the Earth’s surface due to increased concentrations of greenhouse gases (GHGs) such as carbon dioxide, methane, and nitrous oxide.
-
Trend: GHG emissions have risen sharply since the Industrial Revolution, with a particularly steep increase in recent decades. Climate change is now recognized as one of the most urgent global challenges, with record-breaking temperatures and extreme weather events becoming more frequent.
-
Trajectory: Typically, a steeply rising curve, especially since the mid-20th century.
2. Pollution (ii)
-
Description: The introduction of harmful substances into the environment, including air, water, and soil pollution. This includes chemical pollutants, plastics, and nitrogen deposition.
-
Trend: Pollution has increased dramatically with industrialization and urbanization. For example, marine plastic pollution has increased tenfold since 1980, and nitrogen deposition is a growing threat to biodiversity.
-
Trajectory: A steadily rising curve, with some recent plateaus or declines in certain pollutants due to regulation, but overall, pollution remains a major and persistent issue.
3. Land Use Change (iii)
-
Description: The conversion of natural landscapes (forests, wetlands, grasslands) to agriculture, urban areas, or other human uses.
-
Trend: Land use change has been a major driver of biodiversity loss and habitat destruction. While the rate of deforestation has slowed in some regions, overall land conversion continues to threaten ecosystems.
-
Trajectory: A rising curve, but with some leveling off or decline in recent years in certain areas due to conservation efforts and reforestation.
4. Biodiversity Loss (iv)
-
Description: The decline in the variety and abundance of species and ecosystems, driven by habitat destruction, climate change, pollution, and overexploitation.
-
Trend: Biodiversity loss has accelerated with human population growth and economic development. The current rate of species extinction is estimated to be many times higher than the natural background rate.
-
Trajectory: A sharply rising curve, reflecting the rapid increase in threatened and extinct species, especially since the mid-20th century.
Trends and Trajectories: How to Match Them
Given a graph with four curves (A to D) representing the trajectories of these drivers, the correct matching depends on understanding the historical and projected trends for each driver.
-
Climate Change (i):
-
Trajectory: Steeply rising, especially since the mid-20th century.
-
-
Pollution (ii):
-
Trajectory: Steadily rising, with some recent stabilization for certain pollutants.
-
-
Land Use Change (iii):
-
Trajectory: Rising, but may show some leveling off in recent years.
-
-
Biodiversity Loss (iv):
-
Trajectory: Sharply rising, especially since the mid-20th century.
-
Note: The exact shape of each curve may vary depending on the specific data and time scale, but the general trends are as described above.
Evaluating the Options
Let’s review the options for matching trajectories (A to D) to drivers (i to iv):
-
(1) A-iv, B-iii, C-ii, D-i
-
(2) A-i, B-ii, C-iii, D-iv
-
(3) A-ii, B-iv, C-i, D-iii
-
(4) A-iii, B-i, C-iv, D-i
Which is correct?
The correct answer depends on how the curves are plotted and labeled, but based on standard trends in global environmental change literature:
-
Climate Change (i): Steepest rise in recent decades.
-
Biodiversity Loss (iv): Also sharply rising, but sometimes plotted as a cumulative or step-like increase.
-
Pollution (ii): Steady rise, with some plateaus.
-
Land Use Change (iii): Rising, but may level off.
If the graph shows:
-
A: Steepest rise (climate change)
-
B: Steady rise (pollution)
-
C: Rising but leveling off (land use change)
-
D: Sharply rising (biodiversity loss)
Then the correct matching would be:
A-i, B-ii, C-iii, D-iv
However, if the graph shows biodiversity loss (iv) as the steepest, this could vary.
But generally, climate change (i) shows the steepest rise in recent decades, so option (2) is most likely correct if the trajectories are ordered by steepness.
If you are given a graph, always match the steepest rising curve to climate change (i), the steady rise to pollution (ii), the rising but leveling off to land use change (iii), and the sharply rising (but possibly not the steepest) to biodiversity loss (iv).
However, in many standard graphs, biodiversity loss (iv) is also steep, but climate change (i) is typically the steepest.
For most standard cases, the correct matching is:
(2) A-i, B-ii, C-iii, D-iv
But if the graph shows a different order, match based on the shape and steepness of each curve.
Why Accurate Matching Matters
Correctly matching trajectories to drivers is essential for:
-
Environmental Policy: Helps policymakers prioritize interventions based on the most urgent trends.
-
Scientific Research: Guides research focus and funding toward the most impactful drivers.
-
Public Awareness: Improves understanding of which environmental issues are growing fastest and require immediate action.
Key Takeaways
-
Climate change (i): Steepest rise, especially since the mid-20th century.
-
Pollution (ii): Steady rise, with some recent plateaus.
-
Land use change (iii): Rising, but may level off in recent years.
-
Biodiversity loss (iv): Sharply rising, especially since the mid-20th century.
-
The most likely correct matching is:
-
A-i, B-ii, C-iii, D-iv (option 2)
-
-
Always check the graph for the exact shape and steepness of each curve.
Summary Table
| Trajectory | Most Likely Driver | Trend Description |
|---|---|---|
| A | Climate Change (i) | Steepest rise, especially recent decades |
| B | Pollution (ii) | Steady rise, some plateaus |
| C | Land Use Change (iii) | Rising, may level off |
| D | Biodiversity Loss (iv) | Sharply rising, especially since mid-20th century |
Conclusion
Matching the trajectories of global environmental change drivers to their correct causes is a fundamental skill in environmental science. Based on standard trends and the typical shapes of these curves, the correct matching is most likely:
(2) A-i, B-ii, C-iii, D-iv


1 Comment
Pallavi gautam
July 3, 2025Explanation is tooooooo good sir🎉