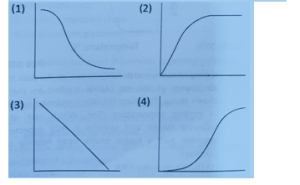
- The graph between the concentration of Single stranded DNA (Y-axis) and decrease in temperature (X- axis during renaturation of DNA can be represented as
Analysis
During DNA renaturation (as temperature decreases after denaturation):
-
At high temperature, almost all DNA is single-stranded (high ssDNA concentration).
-
As temperature decreases, complementary strands reassociate, so ssDNA concentration drops.
-
The transition is cooperative, resulting in a sigmoidal (S-shaped) decrease in ssDNA concentration.
Examining the Options
-
Graph (1): Shows a sigmoidal decrease in ssDNA concentration as temperature decreases.
-
Graph (2): Shows a sigmoidal increase, which does not fit the process.
-
Graph (3): Shows a straight-line decrease, not reflecting the cooperative nature.
-
Graph (4): Shows a sigmoidal increase, which is incorrect.
Conclusion
Graph (1) best represents the process:
-
Y-axis: Single-stranded DNA concentration
-
X-axis: Decreasing temperature
-
Curve: Sigmoidal decrease
Correct answer:
(1)
Keywords
DNA renaturation graph, single-stranded DNA vs temperature, DNA melting curve, sigmoidal decrease, DNA hybridization, DNA stability
Explanation:
The concentration of single-stranded DNA decreases in a sigmoidal fashion as temperature drops and renaturation occurs, which is best illustrated by graph (1).ShareExportRewrite -


