


![(NOV 2020-11) 53. The Hill equation and its plot describe the following enzyme kinetic behaviours A. Saturation Kinetics B. Cooperative Kinetics C. Log Vi/(Vmax — Vi) versus Log [s] D. Log (Vmax — Vi)/Vi versus Log [s]-1 Which one of the following combination represent correct descriptions? (1) A and C (2) B and C (3) B and D (4) A and D](https://www.letstalkacademy.com/wp-content/uploads/2025/09/53.jpg)


![(DEC 2019) 37. Given below is the [P] vs time plot of an enzymatic reaction carried out by the enzyme X Which one of the following statements is the correct interpretation of the data? (1) The Km and Vmax of the enzyme X are 15 and 60 units, respectively. (2) The Vmax is 60 but the Km cannot be determined (3) The Km 15 but the Vmax cannot be determined (4) Neither the Km nor the Vmax of the enzyme X can be determined from these data](https://www.letstalkacademy.com/wp-content/uploads/2025/09/37.jpg)
![(JUNE 2018) 36. The Vmax and Km from a Lineweaver-Burk plot of an enzyme reaction where 1/v = 40µM-1 min at 1/[S] = 0 and 1/[S] = -1.5 x 10² mM-1 at 1/v = 0 are (1) 0.025 µM min-1 and 0.67 x 10⁻²mM (2) 0.025 µM-1 min and 0.67 x 10⁻² (3) 0.025 µM min-1 and 1.5 x 10² mM-1 (4) 0.038 µM min-1 and 0.67 x 10-2mM](https://www.letstalkacademy.com/wp-content/uploads/2025/09/36-1.jpg)
![(SEPT 2022-ll) 35. Given below are plots of the linear derivation of Michaelis-Menten kinetic equation and statements related to the variables (initial velocity-Vo and substrate concentration - [S]) used. A. In plot (i), both x and y axes have dependent variables B. In plot (ii) neither x nor y axis has independent variables C. In plot (i) only y-axis has a dependent variable D. In both the plots, x axis has an independent variable](https://www.letstalkacademy.com/wp-content/uploads/2025/09/35.jpg)
![(SEPT 2022-1) 34. A student was asked to plot a graph representing enzyme kinetic data for initial velocity, vO , and substrate concentration [S] using any of the equations given below. The student used an equation for which neither X-axis nor Y-axis had independent variables. Which one of the following equation might the student have used? (1) 1/ vO = (Km/Vmax) 1/[S]+ 1/Vmax) (2) [S]/vO = [S]/Vmaxx + (Km /Vmax) (3) vO / [S] = (Vmax / Km) - vO / Km (4) vO = V max [S] / Km + [S]](https://www.letstalkacademy.com/wp-content/uploads/2025/09/34.jpg)
![(JUNE 2012) 33. A plot of V/[S] versus V is generated for an enzyme catalyzed reaction, and a straight line is obtained. Indicate the information that can be obtained from the plot. (1) Vmax and Km can be obtained only from a plot of 1/V versus 1/[S]. (2) Km/Vmax from the slope (3) Vmax and Km (4) only Km](https://www.letstalkacademy.com/wp-content/uploads/2025/09/33.jpg)
![(FEB 2022-11) 31. What is the fold difference between v at [S] =Km and v at [S] = 1000 Km where v is the initial velocity of an enzyme catalyzed reaction, [S] is substrate concentration and Km is the Michaelis constant? (1) 1.998 (2) 1000 (3) 2.998 (4) 3.998](https://www.letstalkacademy.com/wp-content/uploads/2025/09/31.jpg)

![(FEB 2022-1) 25. The following statements are being made to define the Michaelis constant (KM). It is: A. Independent of enzyme concentration [E] and substrate concentration [S] B. Equal to the dissociation constant when the [ES] complex dissociates more rapidly than product formation C. Equal to the dissociation constant when product formation is more rapid than [ES] complex dissociation D. An intrinsic property of an enzyme and does not depend on pH, temperature and ionic strength Which one of the following combination of statements is correct? (1) A and B only (2) A, B and D only (3) C and D only (4) A and D only](https://www.letstalkacademy.com/wp-content/uploads/2025/09/25.jpg)


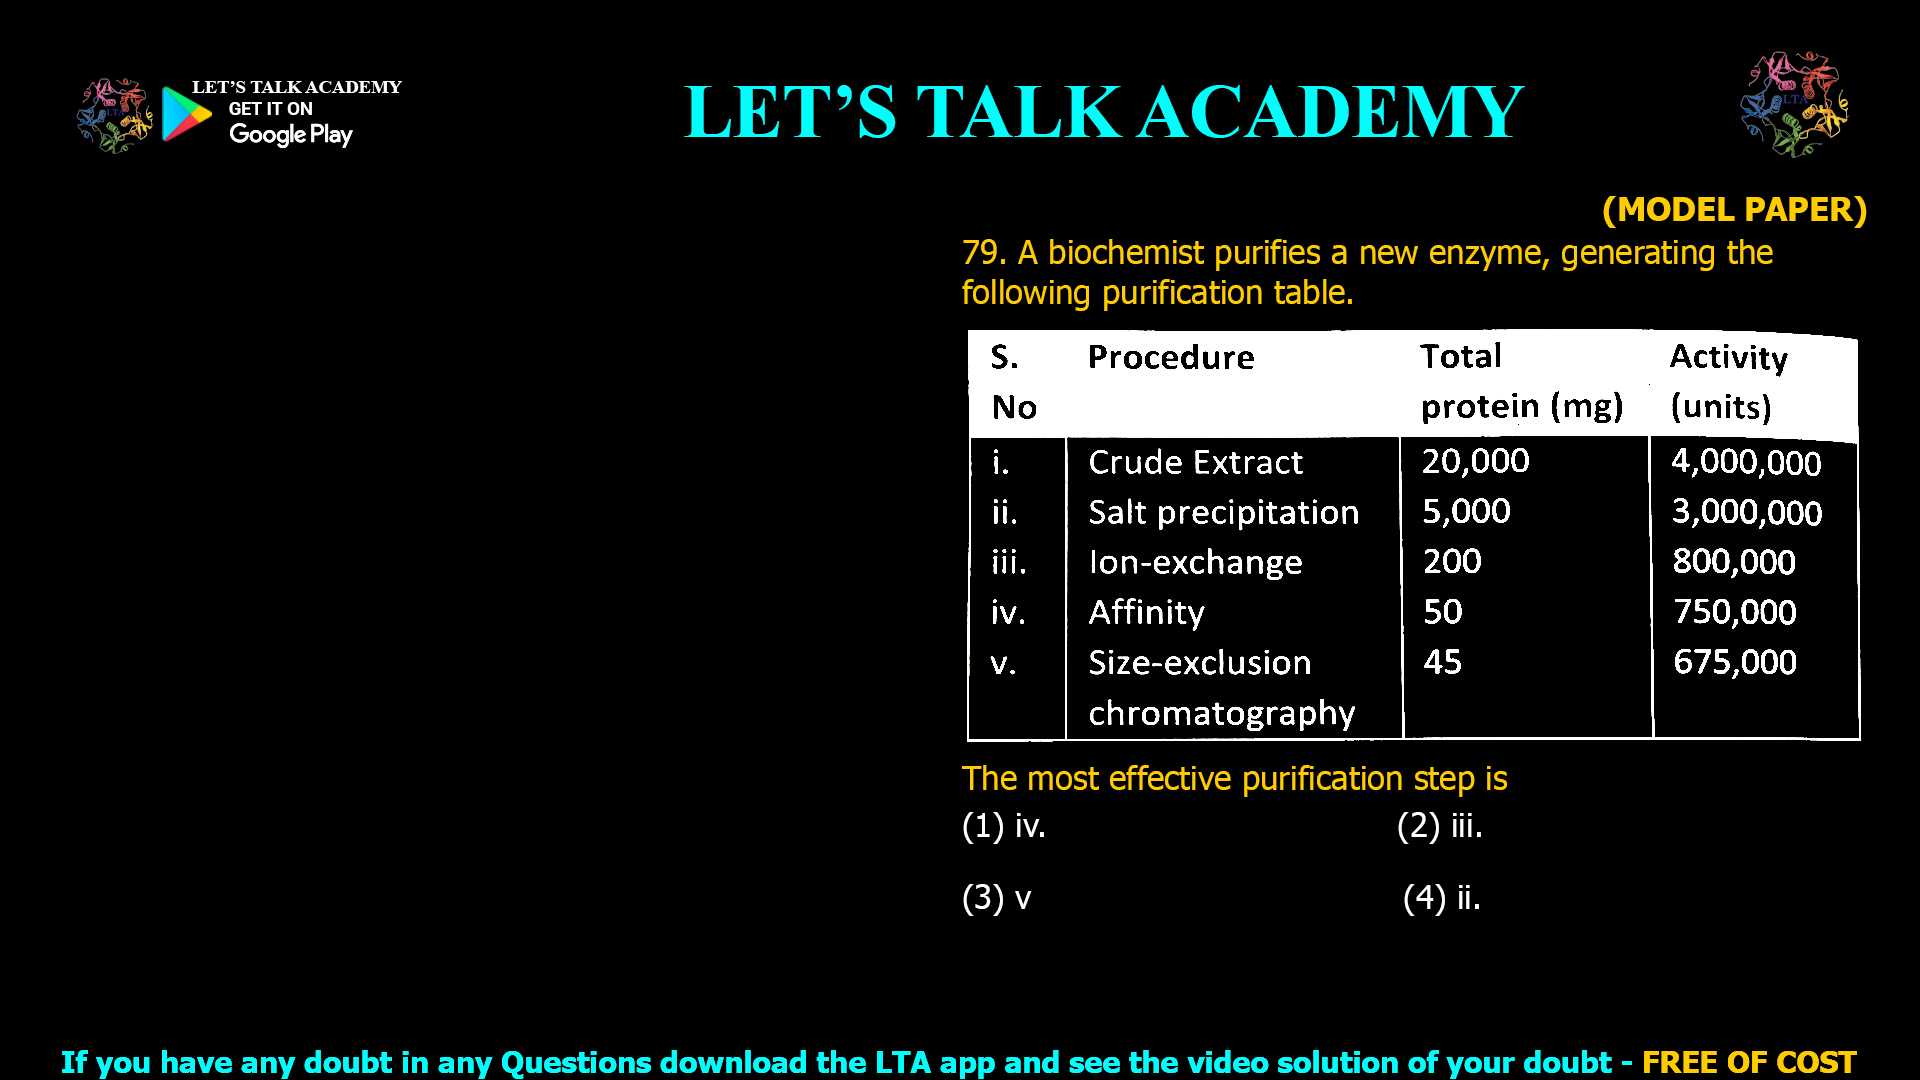
The correct answer is (1) iv. Affinity chromatography. Introduction Enzyme purification is a multistep process designed to isolate proteins from complex biological mixtures. Each stage serves to increase the purity and […]
Enzyme kinetics is one of the most high-scoring topics in CSIR NET Life Science. Every year, at least a few direct or conceptual questions are asked from Michaelis-Menten equation, Lineweaver-Burk plots, enzyme inhibition, and allosteric regulation. If you’re aiming for a top rank, mastering this section is non-negotiable.
In this article, we’ll go through:
Why enzyme kinetics is important for CSIR NET.
Some previous year questions on enzyme kinetics.
Step-by-step solutions and explanations.
Pro tips to crack enzyme-based questions quickly in the exam.
Enzyme kinetics doesn’t just test memory—it tests understanding. The examiners want to see if you can:
Interpret graphs like Michaelis-Menten and Lineweaver-Burk.
Differentiate between competitive, non-competitive, and uncompetitive inhibition.
Apply logic to enzyme efficiency and catalytic turnover problems.
Since enzyme kinetics is a foundation for biochemistry, it overlaps with multiple units such as metabolism, molecular biology, and biotechnology—making it a high-return topic.
Lineweaver-Burk Plot Analysis:
Competitive inhibition → slope increases, intercept same.
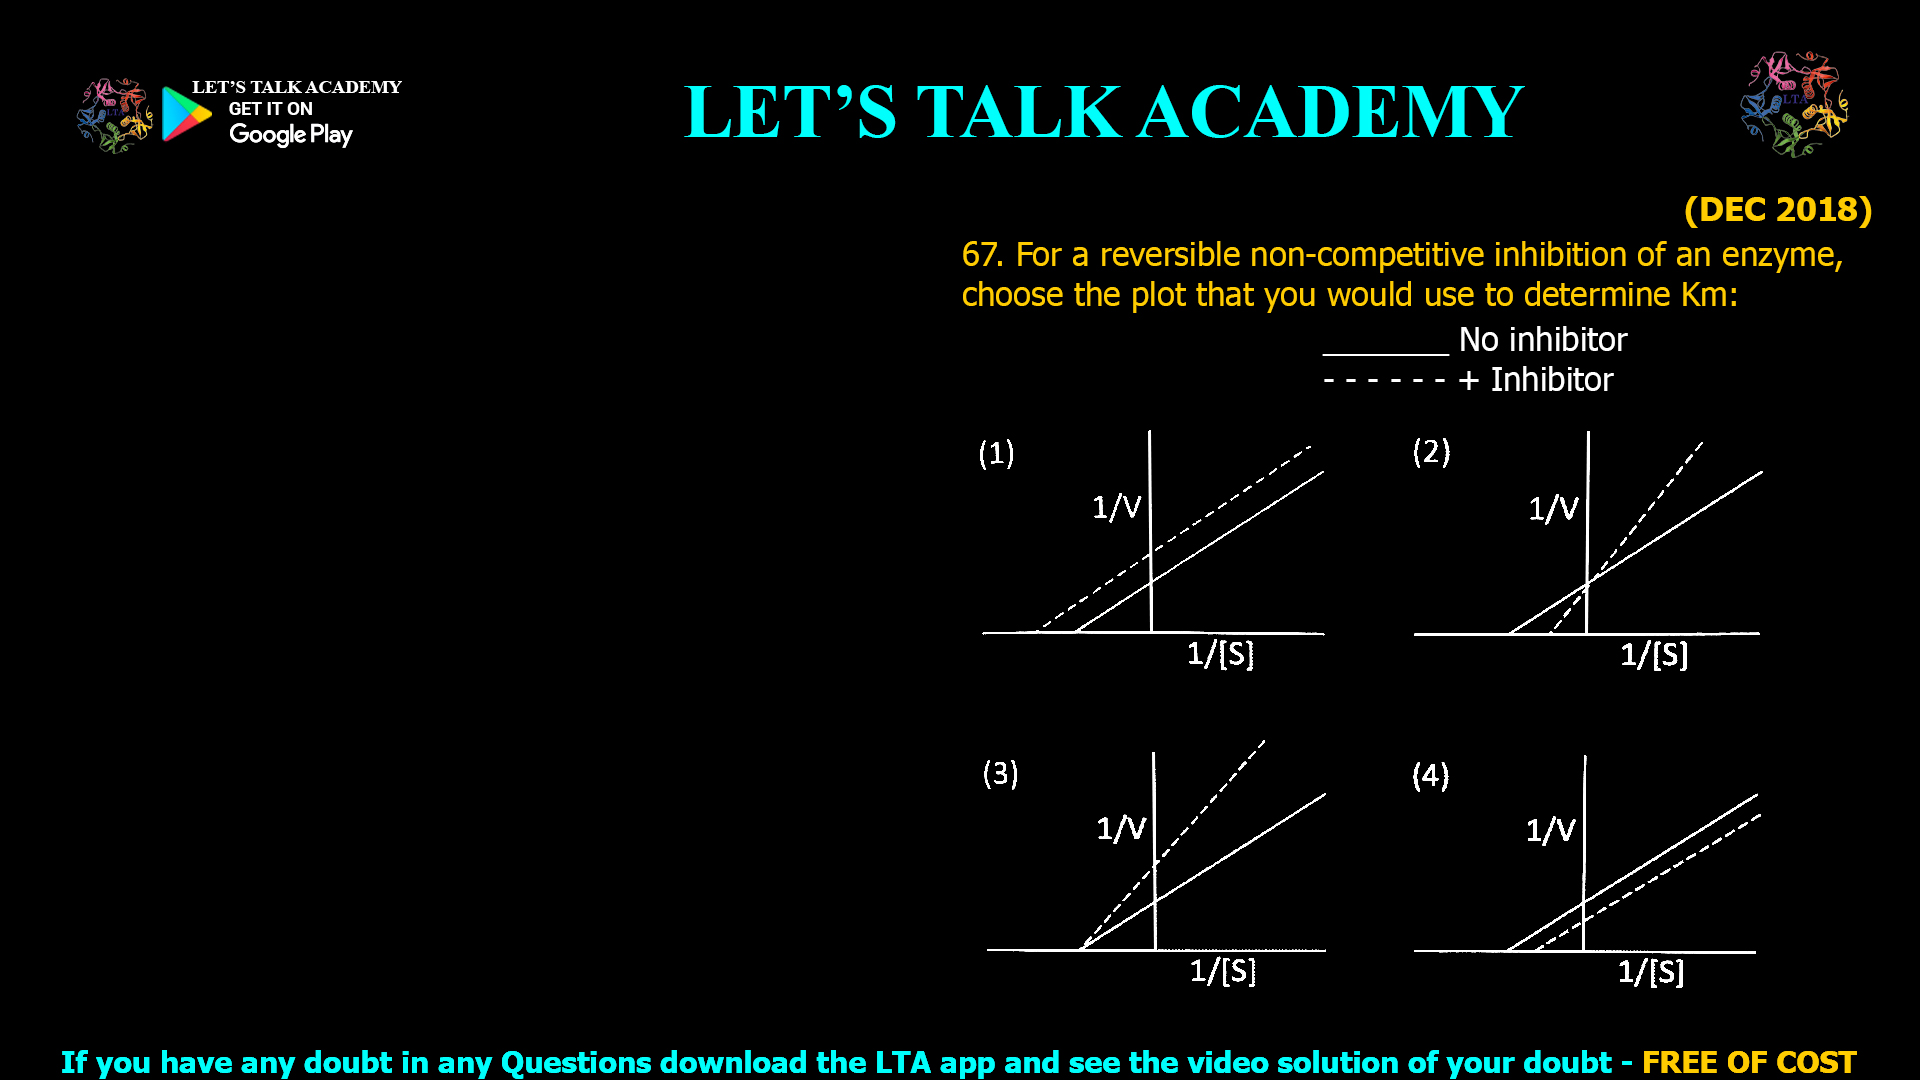
Non-competitive inhibition → slope increases, intercept changes.
Uncompetitive inhibition → parallel lines with same slope.
These are frequently asked in graph-based MCQs.
Memorize equations (Michaelis-Menten, Lineweaver-Burk).
Understand inhibitor effects with a small chart—this saves time in the exam.
Practice previous year questions regularly.
Don’t just solve numericals—analyze patterns of questions asked.
Revise enzyme concepts from trusted sources like Lehninger Biochemistry and Let’s Talk Academy CSIR NET notes.
Enzyme kinetics may look tricky at first, but once you understand the logic, it becomes one of the easiest scoring topics in CSIR NET Life Science. Practicing previous year questions ensures you won’t be surprised in the exam hall.
If you’re serious about cracking CSIR NET, make enzyme kinetics a regular part of your study routine. Start with basic numericals, move to inhibition-based problems, and finally master graph interpretations.
👉 Keep revising, keep practicing, and you’ll see your accuracy in enzyme questions go up.
The correct answer is (1) iv. Affinity chromatography. Introduction Enzyme purification is a multistep process designed to isolate proteins from complex biological mixtures. Each stage serves to increase the purity and […]
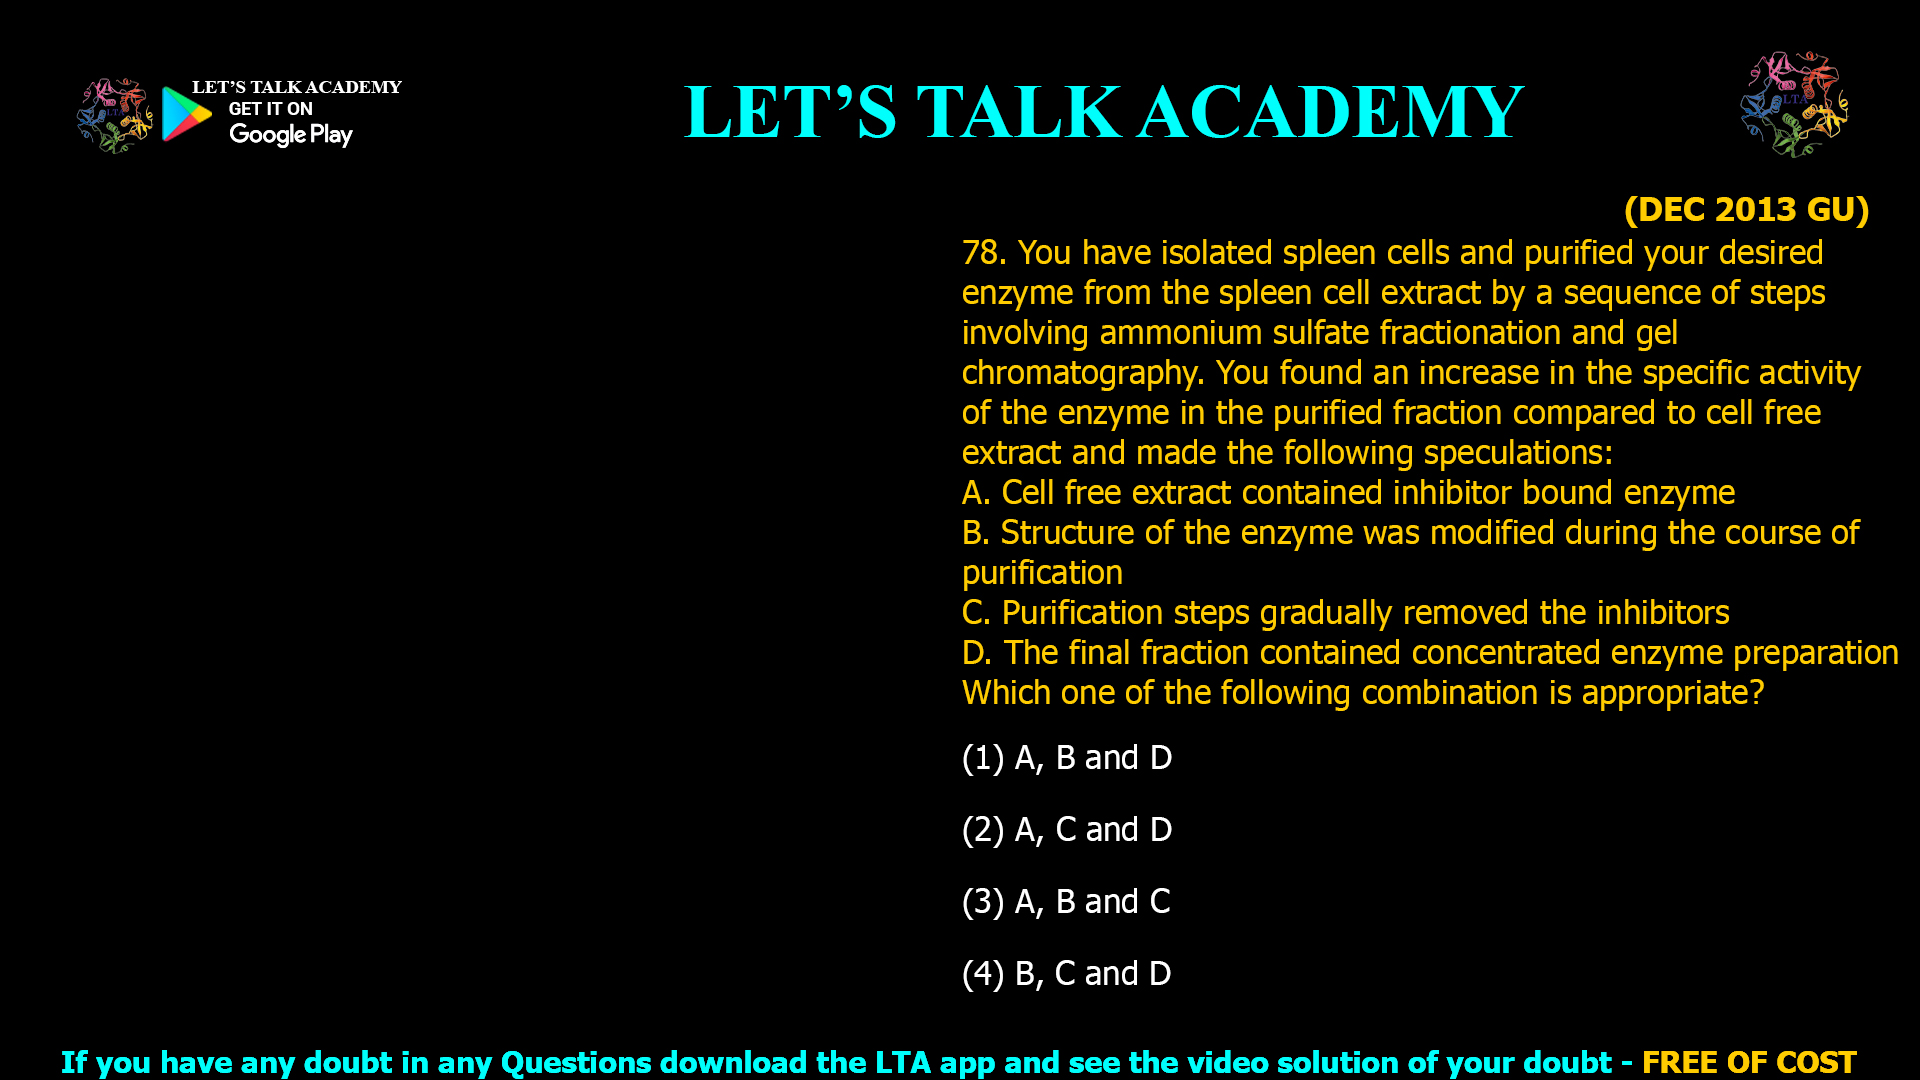
(DEC 2013 GU) 78. You have isolated spleen cells and purified your desired enzyme from the spleen cell extract by a sequence of steps involving ammonium sulfate fractionation and gel […]
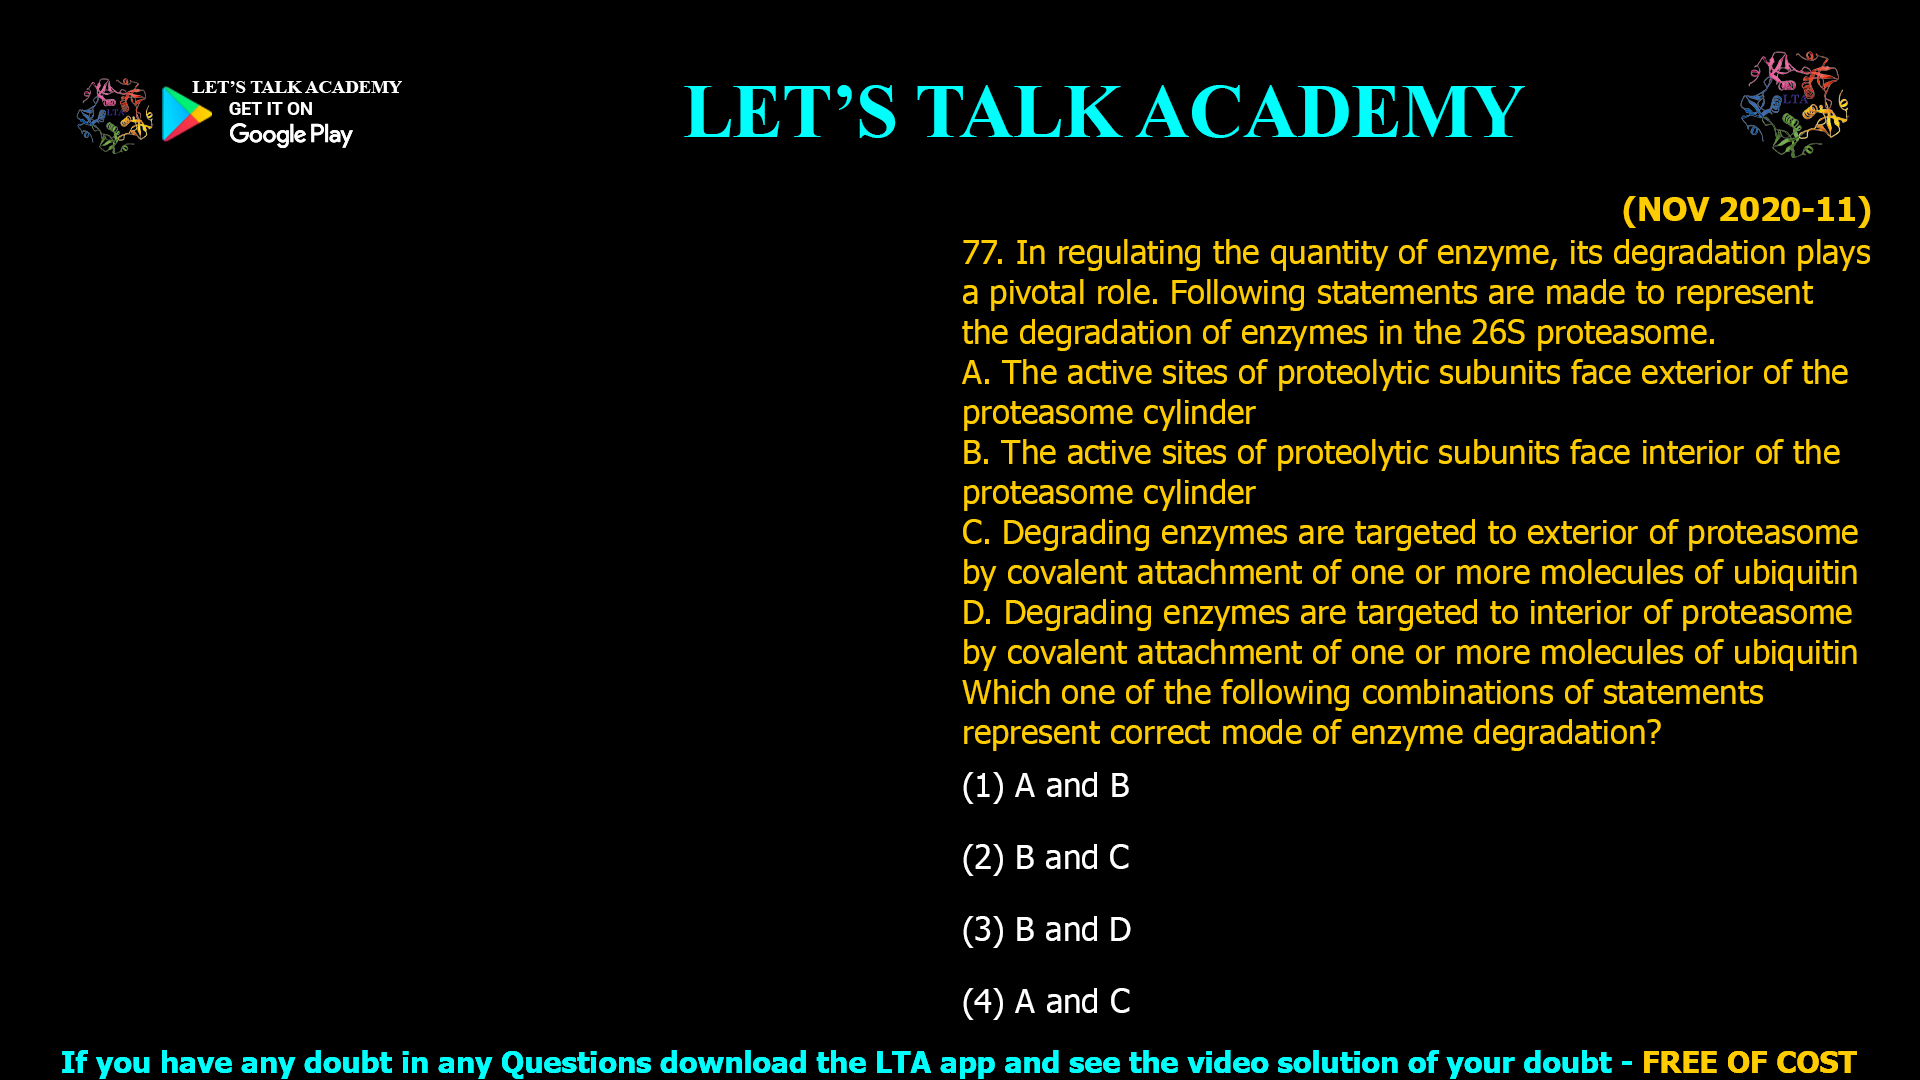
(NOV 2020-11) 77. In regulating the quantity of enzyme, its degradation plays a pivotal role. Following statements are made to represent the degradation of enzymes in the 26S proteasome. A. […]
(DEC 2004) 76. The best example of regulation of enzyme by reversible covalent modification is- (1) Phosphorylation (2) Acetylation (3) Glycosylation (4) proteolytic cleavage The correct answer is (1) Phosphorylation. Introduction […]
![(SEPT 2022-1) 75. Dixon plot is used to study the enzyme inhibition by plotting various expressions of velocity (v) and inhibitor concentration [l] on the X-axis (column A) and Y-axis (column B) as given below: Which one of the following options is the correct combination from columns A and B to draw the Dixon plot? 1. Column A -iv, Column B- i 2. Column A -i, Column B- ii 3. Column A- ii, Column B- iii 4. Column A- iii, Column B- iv](https://www.letstalkacademy.com/wp-content/uploads/2025/09/75.jpg)
The correct answer is (3) Column A-ii, Column B-ii. Introduction Dixon plots are essential tools in enzyme kinetics, allowing researchers to analyze and visualize enzyme inhibition data accurately. The choice of […]

The correct answer is Introduction Quantitative analysis of enzyme inhibition is essential for both basic biochemistry research and drug development. The Dixon plot is a classic graphical method used to […]
![The correct answer is (3) Non-competitive inhibitor. Title Interpreting Double Reciprocal Equations: Identifying Non-Competitive Inhibition in Enzyme Kinetics Meta Description Learn how to distinguish non-competitive inhibition using changes in Lineweaver-Burk plot equations. See why only Vmax changes—classic for non-competitive inhibitors—in detailed biochemical analysis. Slug noncompetitive-inhibition-lineweaver-burk-double-reciprocal-equation Introduction Enzyme kinetics is foundational for understanding metabolic regulation and drug mechanisms. Identifying different inhibition types is pivotal when analyzing altered Lineweaver-Burk plots or double reciprocal equations. Non-competitive inhibition is characterized by a change in the y-intercept (reflecting Vmax) while Km remains unchanged. This article shows how to recognize non-competitive inhibition from the mathematical forms and the biochemical impact it has on enzyme activity. Double Reciprocal Equations Overview Given: Without inhibitor (X): 1 v 0 = K m V m a x ( 1 [ S ] ) + 1 V m a x v 0 1 = V max K m ( [S] 1 )+ V max 1 With inhibitor (X): 1 V 0 = K m V m a x ( 1 [ S ] ) + 1 V m a x ( 1 + [ X ] K X ) V 0 1 = V max K m ( [S] 1 )+ V max 1 (1+ K X [X] ) Analysis: Identifying Inhibition Type In the presence of inhibitor, the slope K m V m a x V max K m (linked to Km) is unchanged. The y-intercept is increased by a factor ( 1 + [ X ] K X ) (1+ K X [X] ), decreasing apparent Vmax but leaving Km unaltered. This matches the action of a non-competitive inhibitor, which binds at a site distinct from the substrate binding site and reduces enzyme activity regardless of substrate concentration. In competitive inhibition, the slope (dependent on Km) would increase; in uncompetitive inhibition, both Km and Vmax are affected proportionally. Mechanistic Understanding Non-competitive inhibitors bind to either free enzyme or the ES complex at an allosteric site. This reduces the overall number of catalytically competent enzyme molecules, decreasing Vmax. Importantly, Km (substrate affinity) remains unchanged—substrate can bind just as well, but some enzyme can’t convert it to product. Summary Table Inhibitor Type Double Reciprocal Equation Change Km Vmax Effect on Plot/Activity Competitive Slope increases, y-intercept unchanged ↑ — Can be overcome by substrate Non-competitive y-intercept increases, slope unchanged — ↓ Can’t be overcome by substrate Uncompetitive Both slope and y-intercept change ↓ ↓ Lower Km and Vmax Visual Summary Non-competitive inhibition: Lines (with and without inhibitor) have the same x-intercept (Km unchanged) but different y-intercepts (Vmax decreased). Conclusion The molecule X is a non-competitive inhibitor, as indicated by the unchanged Km and decreased Vmax represented in the altered double reciprocal equation. This is a classic kinetic pattern, crucial for enzyme pharmacology and molecular biology.](https://www.letstalkacademy.com/wp-content/uploads/2025/09/73.jpg)
The correct answer is (3) Non-competitive inhibitor. Introduction Enzyme kinetics is foundational for understanding metabolic regulation and drug mechanisms. Identifying different inhibition types is pivotal when analyzing altered Lineweaver-Burk plots or […]
(SEPT 2022-11) 72. An enzyme has a Km of 5 x 10⁻⁵ M and a Vmax of 100 µmoles.lit-1. min-1(Km is the Michaelis constant and Vmax is the maximal velocity). […]
(FEB 2022-1) 71. Following statements are made about uncompetitive inhibition of an enzyme: A. Uncompetitive inhibitor binds to both free enzyme as well as an enzyme- substrate complex. B. Addition […]
(DEC 2012) 70. An enzyme catalyzed reaction was measured in the presence and absence of an inhibitor for an uncompetitive inhibition, (1) only Km is increased (2) only is Vmax […]


