


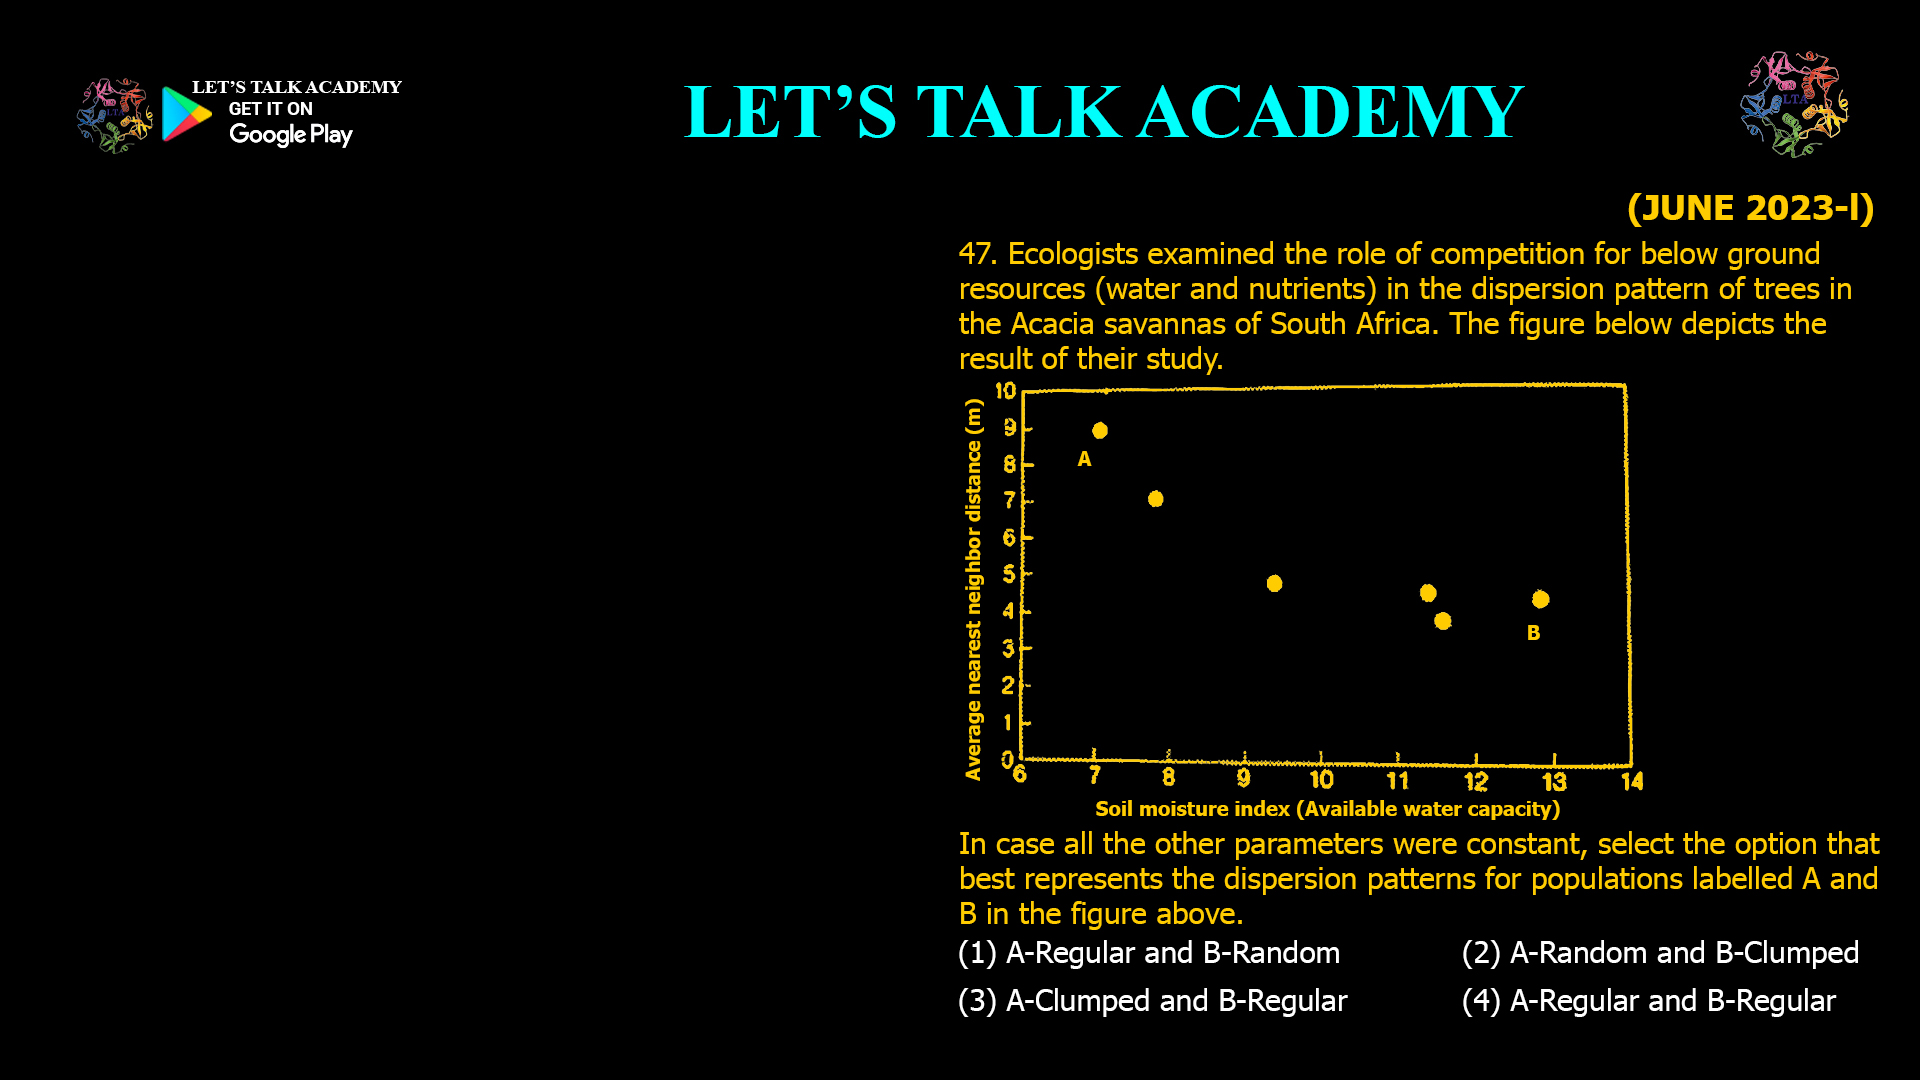
Ecologists examined the role of competition for below ground resources (water and nutrients) in the dispersion pattern of trees in the Acacia savannas of South Africa. The figure below depicts […]
CSIR NET Life Science Previous Year Questions and Solution Species Interactions
Ecologists examined the role of competition for below ground resources (water and nutrients) in the dispersion pattern of trees in the Acacia savannas of South Africa. The figure below depicts […]

46. A tree species has leaves that contain an allelochemical compound that leaches into the soil and prevents the growth of its own seedlings. What kind of dispersion pattern is […]

A researcher observed ants in contact with plant hoppers that were feeding on tree sap. Which of the following conclusions made by her would be correct? (1) This is an […]
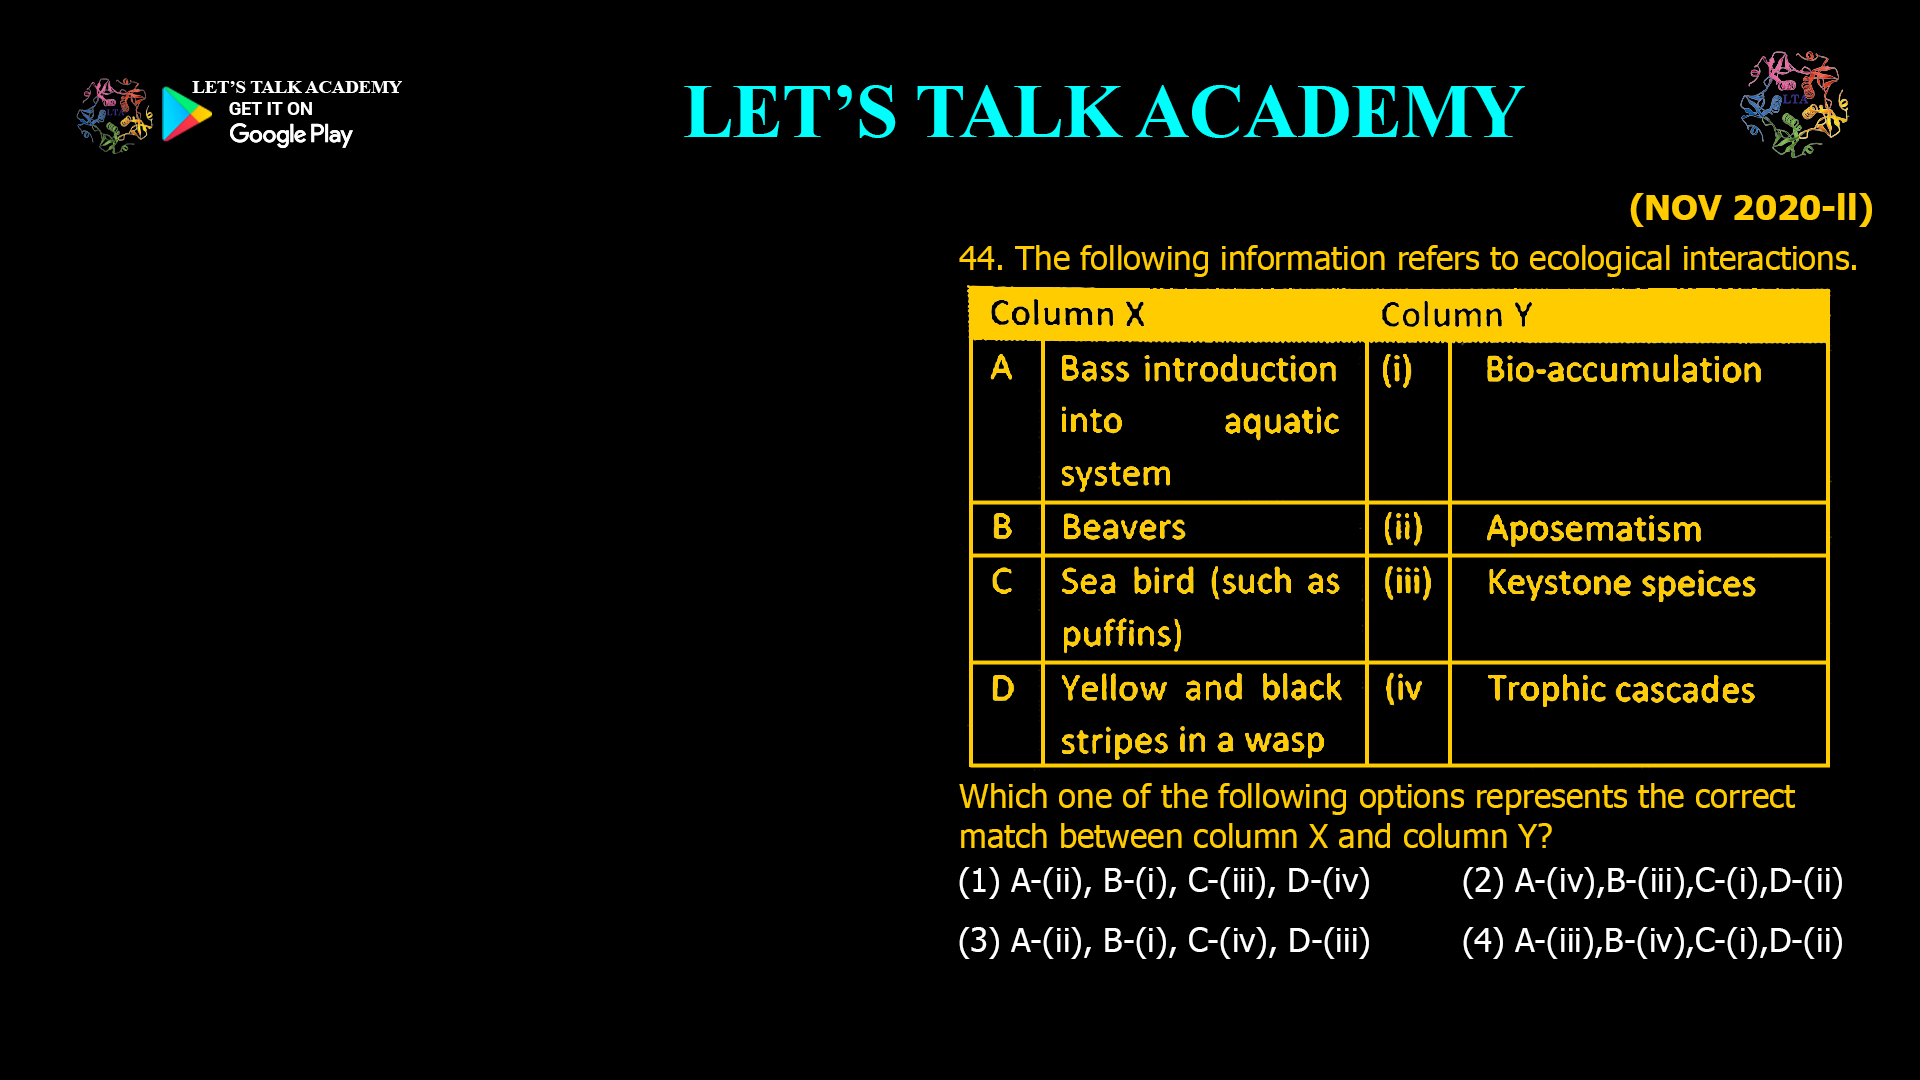
The following information refers to ecological interactions. Which one of the following options represents the correct match between column X and column Y? (1) A-(ii), B-(i), C-(iii), D-(iv) (2) A-(iv), […]
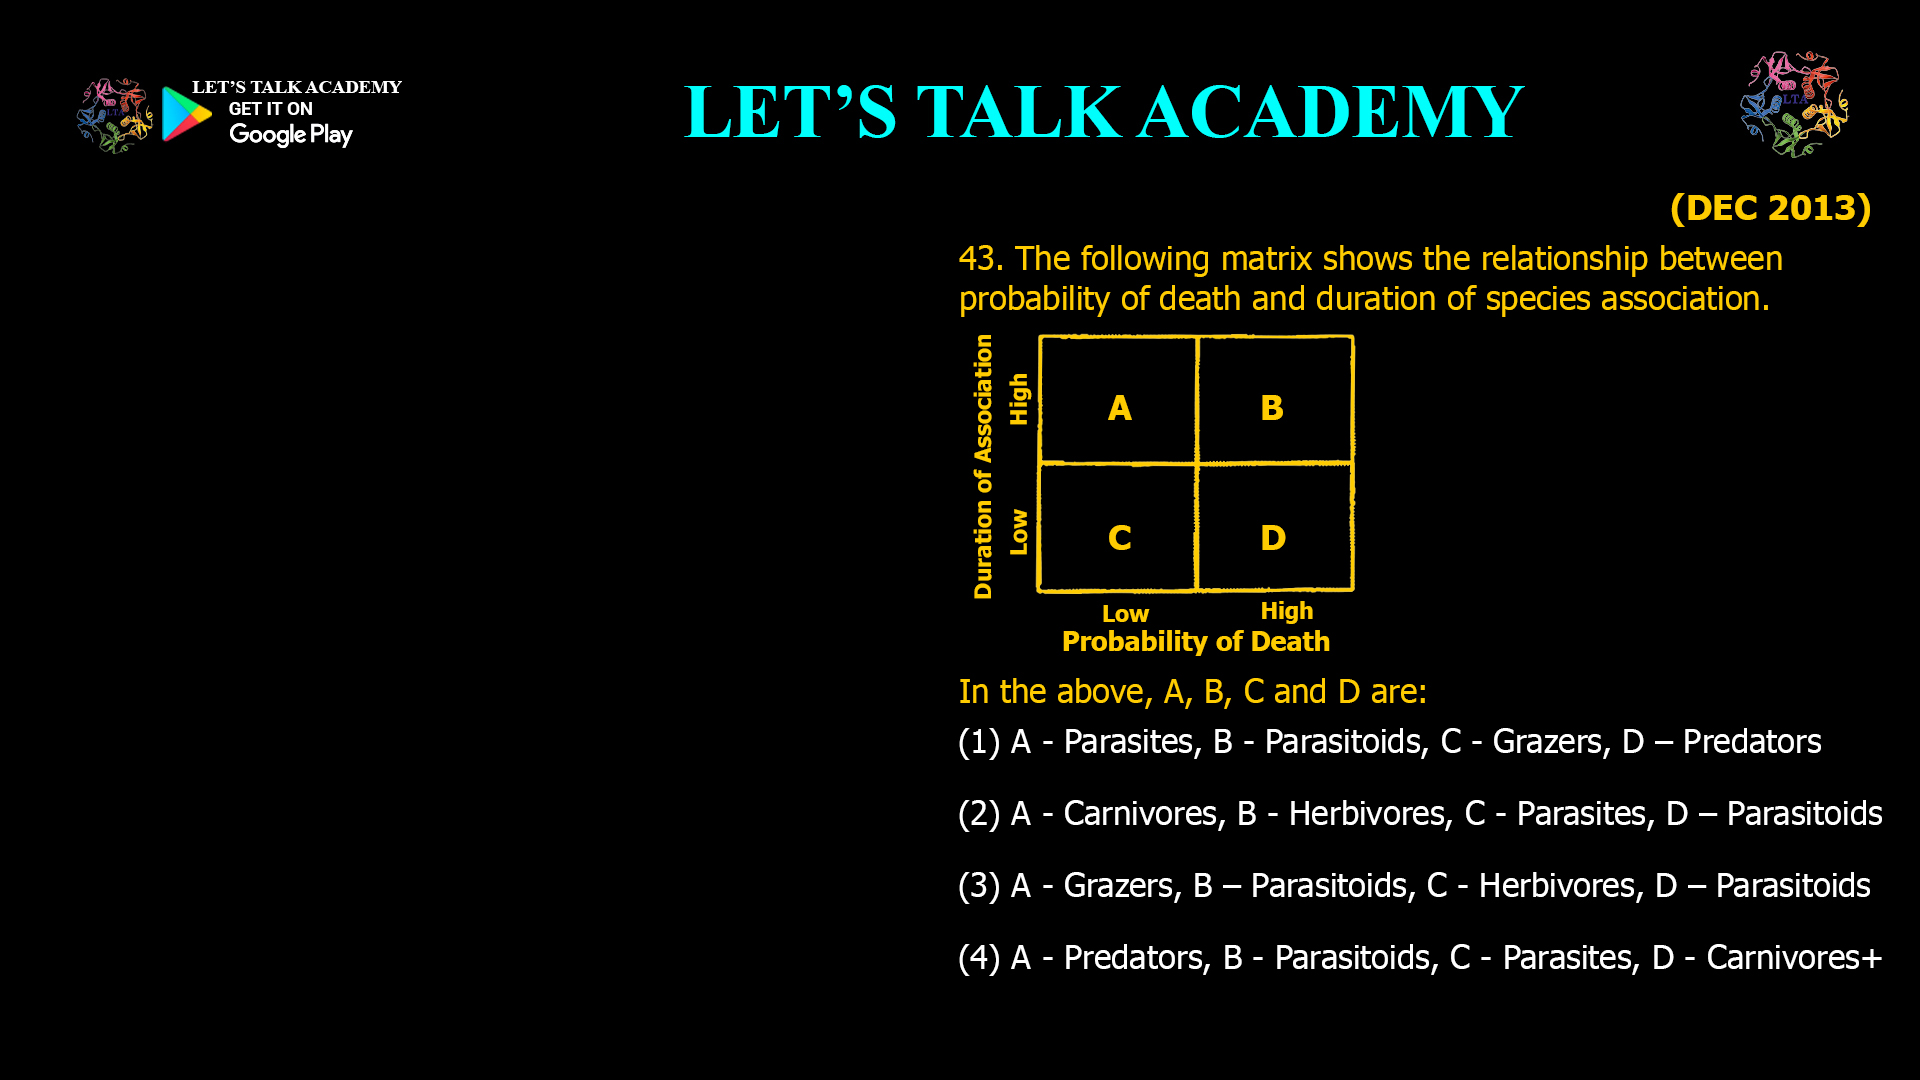
The following matrix shows the relationship between probability of death and duration of species association. In the above, A, B, C and D are: (1) A – Parasites, B – […]
Consider the following assumptions i. All known living organisms possess parasites ii. A single host species can harbor more then one type of parasites iii. Parasites are species specific From […]

In grasslands, cattle egrets follows grazing cows. Cow during grazing exposes insects from grasses to egrets. This is an example of (1) Commensalisms (2) parasitism (3) Amensalism (4) Mutualism In […]

In a high-altitude meadow region, it was observed that over the last five years 20 forb species flowered 2-3 weeks earlier than their long-term average time of flowering. At the […]
A plant with blue-coloured flowers was observed to attract a large number of pollinators. However, these flowers were not producing any nectar. Which of the following can be a logical […]

A red coloured tubular flower without any odour is most likely to be pollinated by (1) beetles. (2) bees. (3) butterflies. (4) birds. Understanding Pollination Syndromes Flowering plants have evolved […]


