How is genetic variation in a population related to inbreeding and finite population size? (1) Both finite population size and inbreeding lead to decrease in genetic variation. (2) Only inbreeding leads to a decrease in genetic variation, population size has no effect. (3) Both inbreeding and finite population size lead to an increase in genetic variation. (4) Neither of the two factors has any effect on genetic variation in the population.

How Inbreeding and Finite Population Size Reduce Genetic Variation

Which of the following evolutionary processes played an important role in the evolution of immune system? (1) Reproductive isolation (2) Adaptive radiation (3) Neutral evolution (4) Co-evolution

Co-evolution: The Key Evolutionary Process Shaping the Immune System

The following statements explain various evolutionary outcomes: (A) Within a lineage, organisms show a constant rate of extinction. (B) Even in the absence of changing interactions, organisms are constantly evolving. (C) Organisms with novel genotypes are at a selective disadvantage. (D) Coevolution between two interacting species act to maintain genetic variation through time. Which of the following combinations of the above statements are supported by the 'Red Queen hypothesis'? (1) A and D (2) A and B (3) B and C (4) C and D

 Understanding the Red Queen Hypothesis: Evolutionary Dynamics and Supported Statements

The "Red Queen Hypothesis" is related to (1) the mating order in the harem of a Polygamous male. (2) the elimination by deleterious mutations by sexual reproduction. (3) mate selection process by a female in a lek. (4) the evolutionary arms race between the host and the parasite

The Red Queen Hypothesis: The Evolutionary Arms Race Between Hosts and Parasites

Major reason for evolution for diversity in immune system is (1) Natural selection (2) Neutral mutations (3) Directed evolution (4) Co-evolution

Co-evolution: The Driving Force Behind Immune System Diversity

An organism influence the evolutionary pace of the other organism in (1) Co-evolution (2) Parallel evolution (3) Convergent evolution (4) Divergent evolution

Co-evolution: How Organisms Influence Each Other’s Evolutionary Pace

Among the following interactions which will not force co-evolution? (1) Commensalisms (2) Parasitism (3) Mutualism (4) Interspecific competition

Why Commensalism Does Not Drive Co-evolution: Understanding Species Interactions

The changes in prey brings changes in predator and vice-versa. Such an evolution due to competition for existence is termed as- (1) Converging evolution (2) Diverging Evolution (3) Co-evolution (4) Parallel Evolution

Co-evolution: How Predators and Prey Shape Each Other’s Evolutionary Path

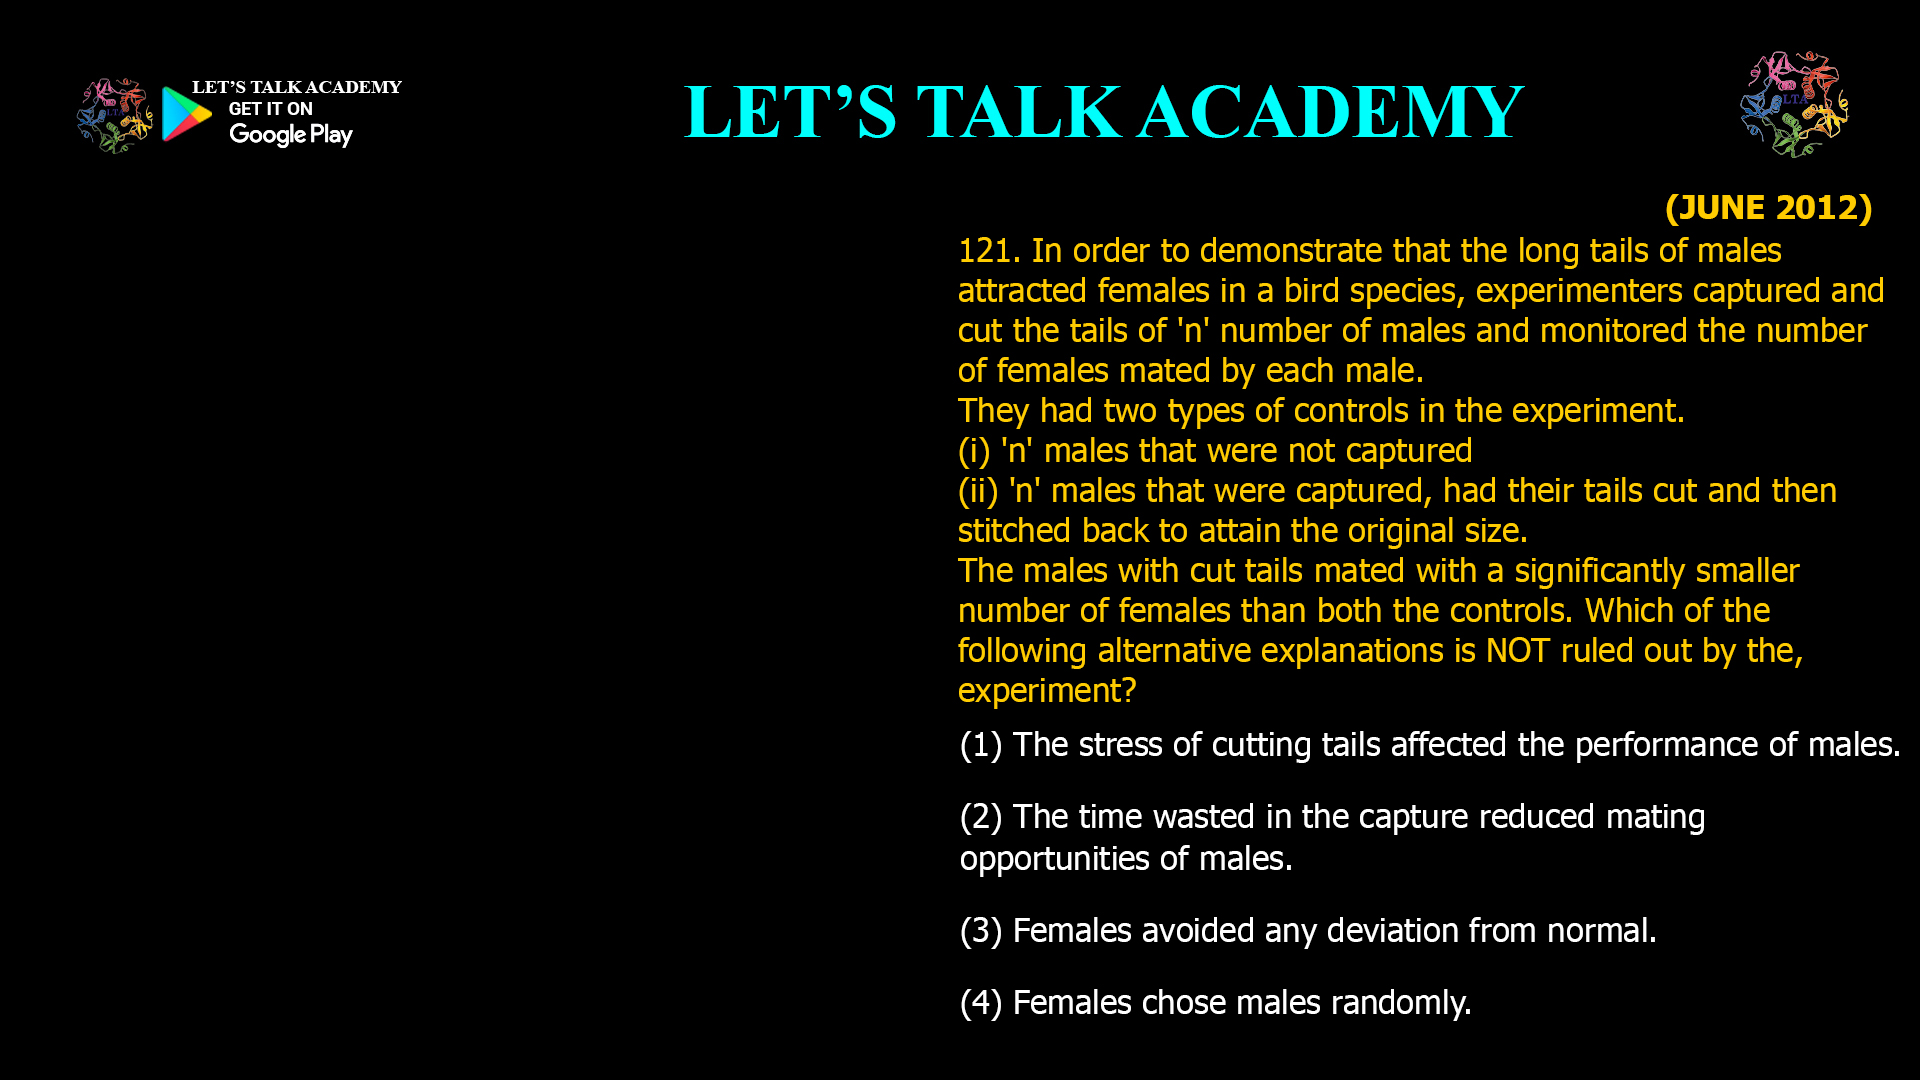
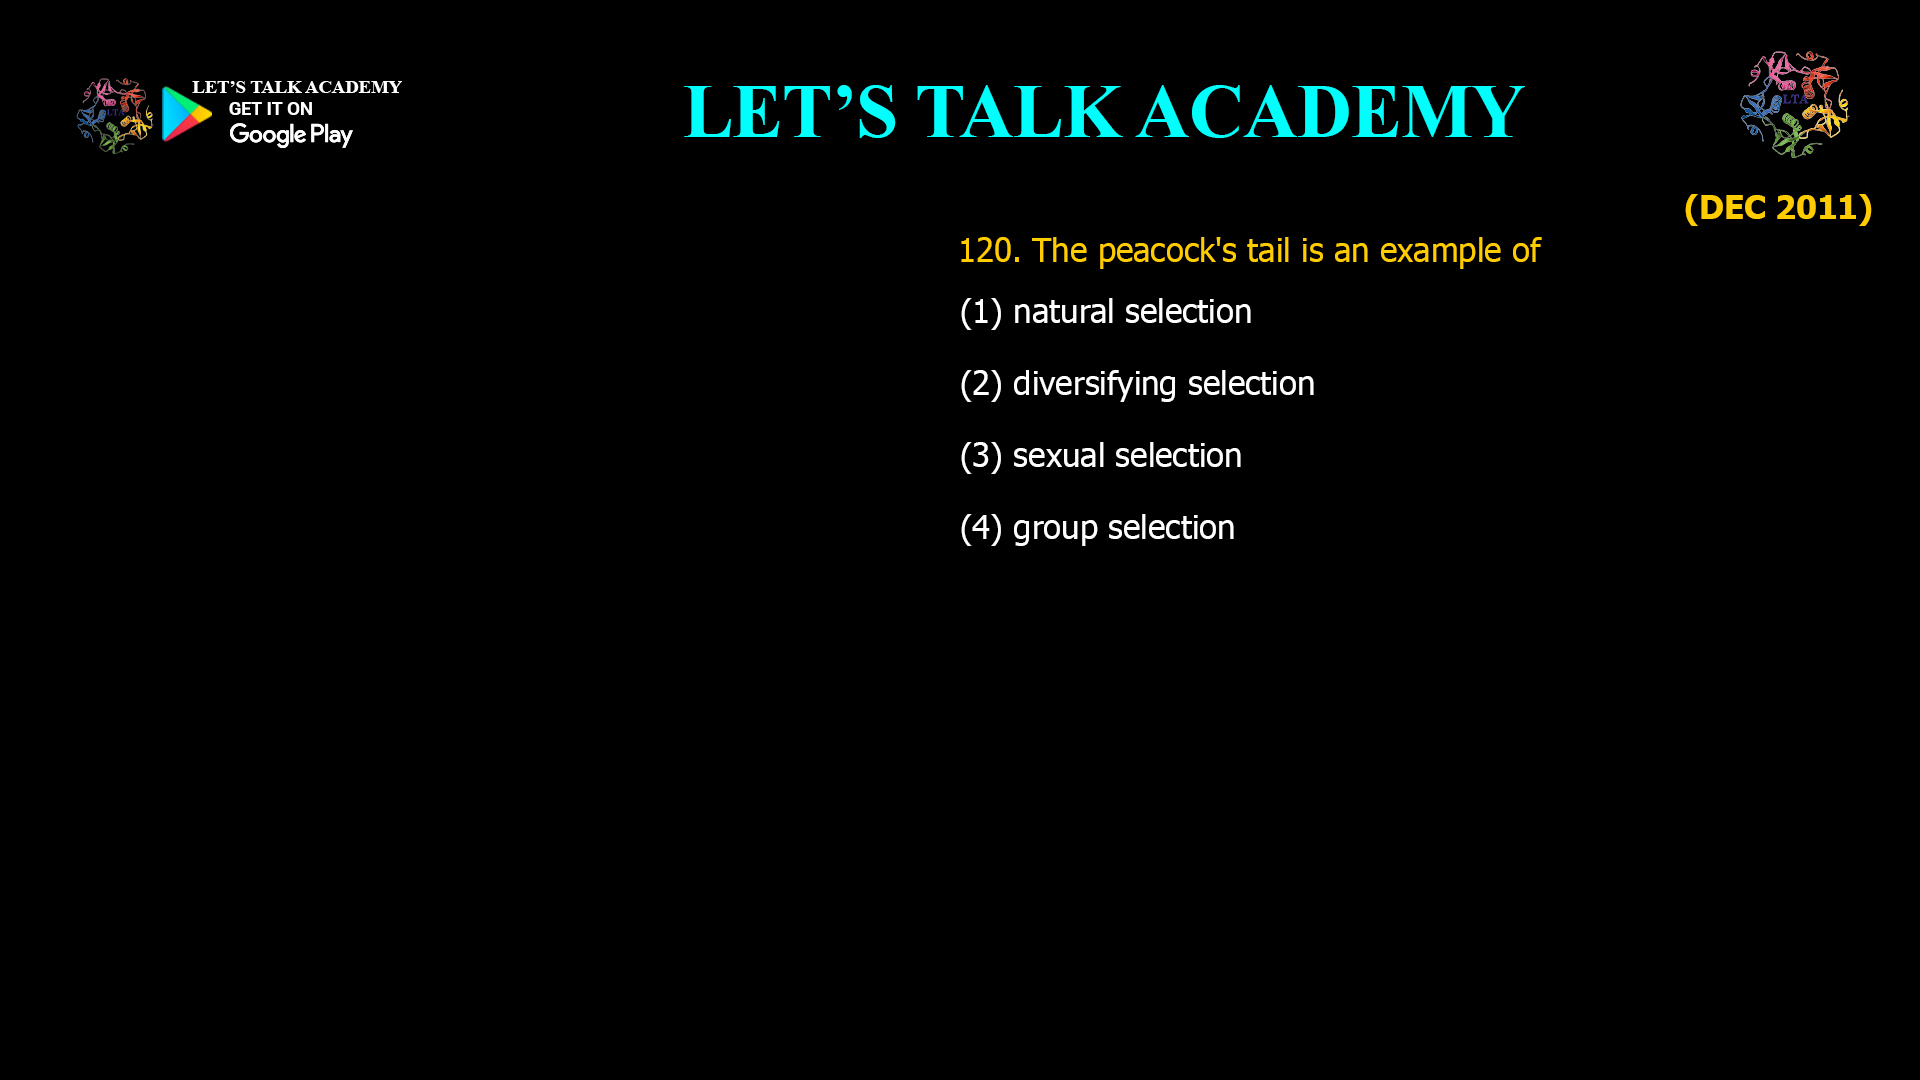
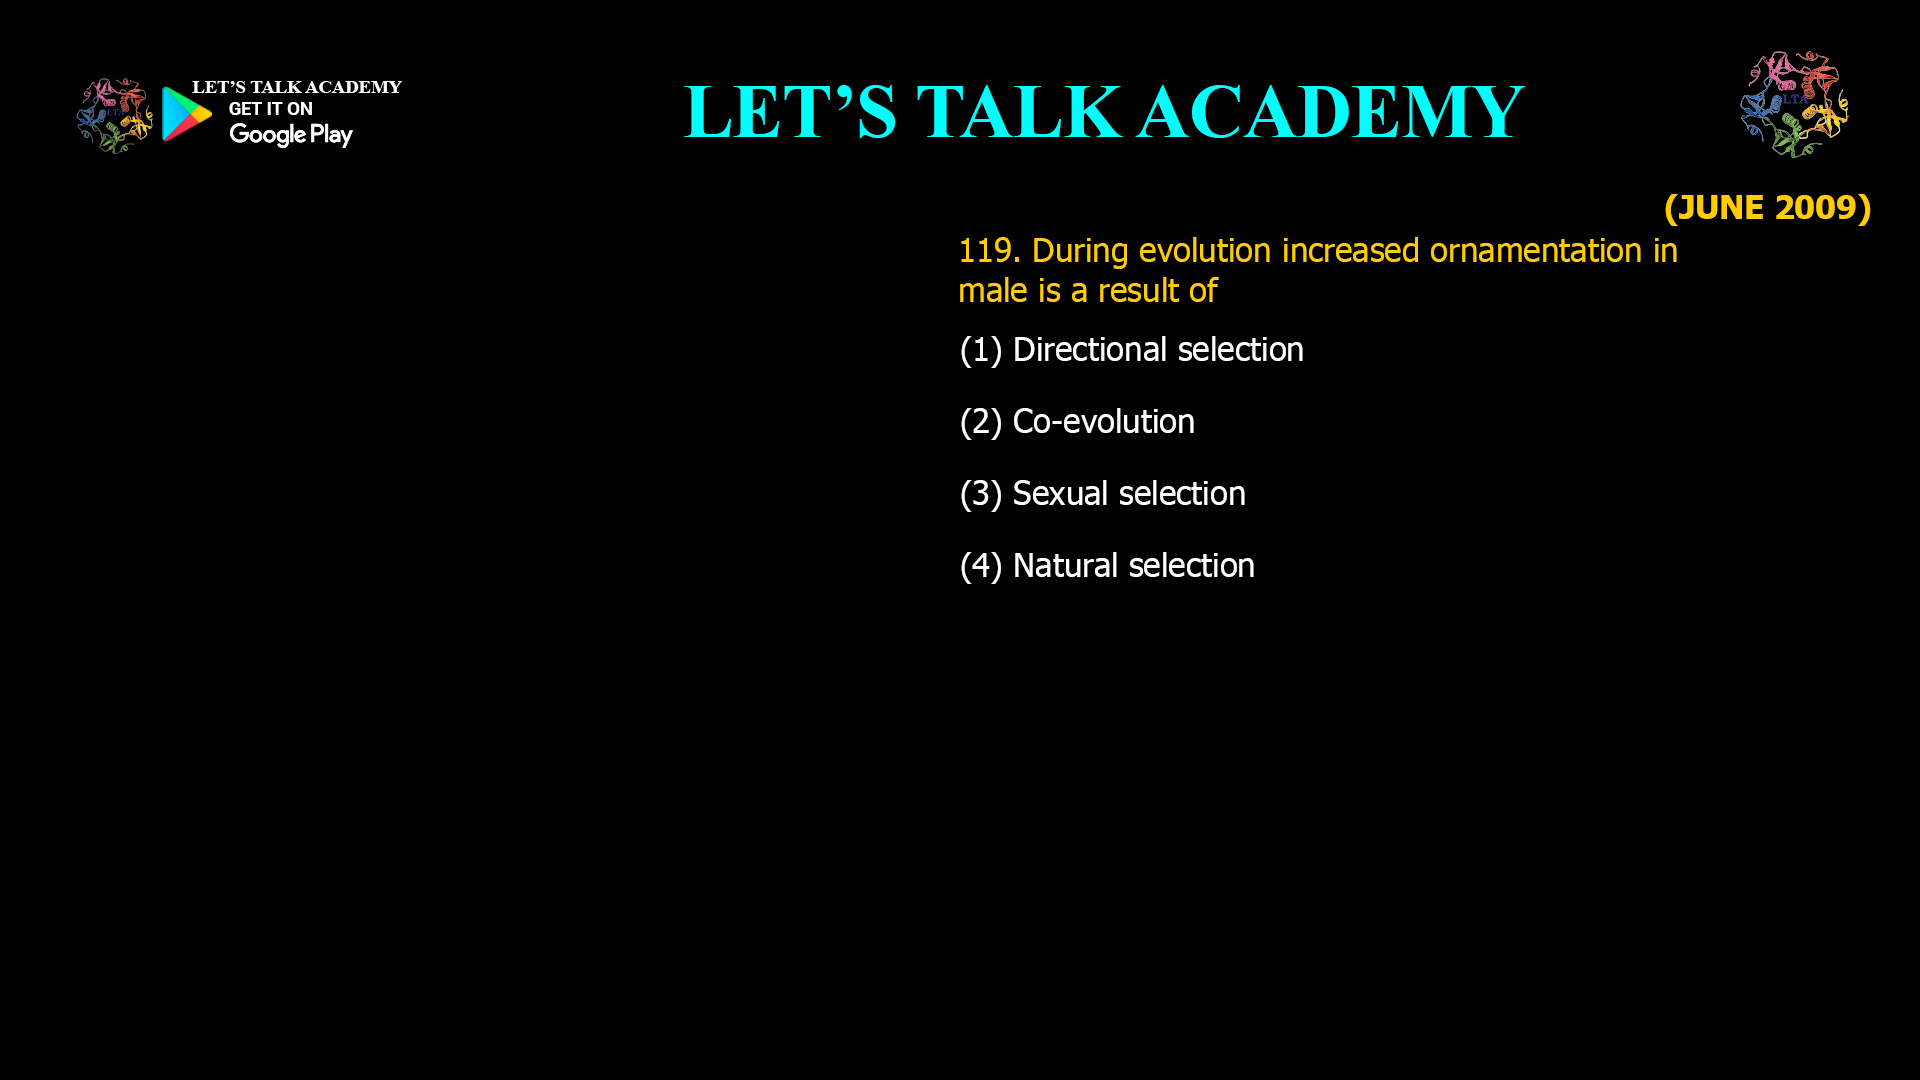
The long feather train of a peacock is quoted as an example supporting (1) Hamilton's rule. (2) Zahavi's handicap principle (3) The Red Queen hypothesis. (4) Haldane's rule.

The Peacock’s Tail and Zahavi’s Handicap Principle: Honest Signals in Evolution

123. Sexually reproducing organisms employ signals to attract mates. If such signals honestly reflect an individual's quality, then which of the following is expected? (1) Organisms in poor metabolic condition signal more. (2) Organisms in poor metabolic condition signal less. (3) Organisms will not modulate signalling behaviour with metabolic condition. (4) Organisms in good metabolic condition will signal less.

Honest Signaling in Mate Choice: Why Organisms in Poor Condition Signal Less

Sexual selection results in variation in the reproductive success of males, often due to female choice with particular phenotypes. This type of sexual selection is because (1) Males cannot compete with other males (2) cost of breeding is higher for females as compared to males (3) inappropriate mating results in a similar reduction in fitness of females and males (4) males are a limiting resource for females

Why Sexual Selection Favors Female Choice: The Role of Reproductive Investment in Evolution

In order to demonstrate that the long tails of males attracted females in a bird species, experimenters captured and cut the tails of 'n' number of males and monitored the number of females mated by each male. They had two types of controls in the experiment. (i) 'n' males that were not captured (ii) 'n' males that were captured, had their tails cut and then stitched back to attain the original size. The males with cut tails mated with a significantly smaller number of females than both the controls. Which of the following alternative explanations is NOT ruled out by the, experiment? (1) The stress of cutting tails affected the performance of males. (2) The time wasted in the capture reduced mating opportunities of males. (3) Females avoided any deviation from normal. (4) Females chose males randomly.

Experimental Evidence for Female Choice in Birds: What the Tail-Cutting Experiment Reveals About Sexual Selection

The peacock's tail is an example of (1) natural selection (2) diversifying selection (3) sexual selection (4) group selection

The Peacock’s Tail: A Classic Example of Sexual Selection in Evolution

During evolution increased ornamentation in male is a result of (1) Directional selection (2) Co-evolution (3) Sexual selection (4) Natural selection

The Evolution of Male Ornamentation: How Sexual Selection Drives Extravagant Traits

Four different species concepts are given below: A. Species separate based on their use of different ecological niches and their presence in different habitats and environments. B. Differences in physical characteristics or molecular characteristics are used to distinguish species. C. Species are distinct if they are reproductively isolated. D. Phylogenetic trees and analyses of ancestry serve to differentiate species. Which of the following gives the correct names of the above concepts? (1) A: Biological; B: Phylogenetic; C: Evolutionary; D: Ecological (2) A: Ecological; B: Phylogenetic; C: Biological; D: Evolutionary (3) A: Evolutionary; B: Ecological; C: Biological; D: Phylogenetic (4) A: Phylogenetic; B: Evolutionary; C: Ecological; D: Biological

Understanding the Four Major Species Concepts in Biology

The given below is the graphical representation of the changes in morphological features over a period of the geological time scale, where population A accumulates heritable morphological features and give rise to distinct species B. Population B splits in to a distinct species B2 Which of the following lineage represent the pattern of speciation by cladogenesis? (1) Lineage 1 (2) Both lineage 1 and 2 (3) Lineage 2 (4) Neither of the lineage 1 and 2

Cladogenesis: Understanding the Evolutionary Splitting of Lineages

In a study of sexual isolation in a species of salamander, scientists brought together males and females from different populations and from the same population. They observed the frequency of mating and calculated a sexual isolation index. One graph shows the relationship between mating frequency and genetic distance, and the other shows the relationship between sexual isolation index and geographic isolation. Choose the appropriate terms for of X1, Y1, X2 and Y2 in the figures, above. (1) X1 = Geographic distance, Y1 = Sexual isolation index; X2 = Genetic distance, Y2 = mating frequency (2) X1 = Geographic distance; Y1 = mating frequency; X2 = Genetic distance, Y2 = Sexual isolation index (3) X1 = Genetic distance; Y1 = mating frequency; X2 = Sexual isolation index; Y2 = Geographic distance (4) X1= Genetic distance; Y1 = Geographic distance; X2 = Sexual isolation index; Y2 = mating frequency

Decoding Sexual Isolation in Salamanders: Linking Genetic, Geographic, and Mating Data

Temporal isolation in breeding seasons between closely related species leads to reproductive isolation. Given below are breeding seasons of different species of frogs. Which of the above plots represents temporal isolation in breeding seasons among closely related sympatric species? (1) Plot A (2) Plots A and B (3) Plots B and C (4) Plots A and C

Temporal Isolation in Frogs: How Differences in Breeding Seasons Prevent Hybridization

Orchids of the genus Cryptostylis are known to maintain reproductive isolation because their flowers look and smell like females of the wasps of genus Lissopimpla. When the male wasp visits and attempts to mate with the flower, the shape of anther and stigma allows correct placement and transfer of pollen to the wasp, which then transfers the pollen to species specific flower that it next attempts to mate with. This prezygotic barrier that prevents inter-species cross-pollination in Cryptostylis is best explained by: (1) behavioural isolation through mimicry (2) mechanical isolation through mimicry. (3) temporal isolation (4) habitat isolation

How Behavioural Isolation Through Mimicry Maintains Reproductive Isolation in Cryptostylis Orchids

The following list represents two types of reproductive isolation (Column P) that can lead to speciation. Column Q represents the processes by which these isolations can occur. Select the option that represents the correct match between the prezygotic and postzygotic isolation types listed in Column P and the processes described in Column Q? (1) A-i and ii, B-i and iii (2) A-i and iii, B- ii only (3) A-i and iv, B-ii and iii (4) A- ii only, B-i and iv

Prezygotic and Postzygotic Isolation: Matching Mechanisms and Processes in Speciation

Wolbachia are obligate intracellular bacteria, many different strains of which are abundantly present in insects. They induce mating incompatibility in host, i.e. males infected with one strain can only fertilize females infected with the same strain. No other pathological effects are observed in host. A possible evolutionary consequence of this phenomenon would be: (1) Extinction of many insect species. (2) Termination of sexual reproduction in many insect species. (3) Co-extinction of host and parasite. (4) Reproductive isolation leading to rapid speciation in insects.

Wolbachia and Insect Evolution: How Reproductive Isolation Drives Rapid Speciation

A species of grass grows around a mine area having patches of heavy metal contaminated soil. Some of the populations of the species grew selectively on the soil that was contaminated with heavy metals. Over a period of time, though the tolerant and non- tolerant grass populations were continuously distributed and not separated by geographical barriers, they eventually evolved different flowering times and became different species. What kind of speciation would you call this? (1) Allopatric speciation (2) Sympatric speciation (3) Parapatric speciation (4) Bottle-neck effect

 Parapatric Speciation: How Environmental Gradients Drive the Evolution of New Species in Grasses

Two populations of squirrels evolved across two regions separated by a large geographic barrier. Over a long period of time these populations are reproductively and geographically isolated from each other. This is an example of (1) sympatric speciation (2) allopatric speciation (3) artificial speciation (4) anagenesis

Allopatric Speciation: How Geographic Barriers Lead to the Evolution of New Squirrel Species

The speciation in which a population splits into two geographically isolated populations experience dissimilar selective pressure and genetic drift is known as (1) sympatric speciation. (2) parapatric speciation. (3) peripatric speciation. (4) allopatric speciation.

 Allopatric Speciation: How Geographic Isolation Drives the Emergence of New Species

Which is correct explanation for sibling species? (1) Species which are morphologically different but can interbreed (2) Species which look morphologically similar but reproductively isolated (3) Species which are morphologically different and reproductively isolated (4) Species which are morphologically alike and can interbreed

Sibling Species: Morphologically Similar but Reproductively Isolated Organisms

105. Morphologically similar species when interbreed produce viable fertile offspring. They are considered as single species according to (1) biological species concept (2) evolutionary species concept (3) Genetic species concept (4) Morphospecies concept

Understanding the Biological Species Concept: Defining Species by Interbreeding and Fertility

Which is most important barrier for speciation in a sexually reproducing organisms? (1) Geographical (2) Reproductive (3) Temporal (4) Ethological

 Reproductive Barriers: The Most Crucial Factor in Speciation of Sexually Reproducing Organisms

Which species concept stress mainly on failure of interbreeding to keep them in distinct species (1) Biological species concept (2) Ecological species concept (3) Morphological species concept (4) Phylogenetic species concept

The Biological Species Concept: Defining Species Through Reproductive Isolation

If a certain parasitic bacteria on insect prevents cross breeding among them. It will lead into (1) rapid speciation (2) Divergence of insects (3) Extinction of insects (4) No effect

How Parasitic Bacteria Drive Rapid Speciation in Insects

101. The biological species concept defines species as a group of populations that are reproductively isolated from others. However, this definition is not applicable to groups where sexual reproduction has not been observed yet or is extremely rare. Choose the correct option of organisms where biological species concept may therefore not apply: (1) Monocots and basal angiosperms (2) Ascomycetes and oligochaetes (3) Mosses and liverworts (4) Cyanobacteria and Euglenophyta

Why the Biological Species Concept Does Not Apply to Cyanobacteria and Euglenophyta

A group of organisms that can successfully interbreed and produce fertile offspring termed as (1) Biological species (2) Taxonomic species (3) Morphospecies (4) Sibling species

Biological Species: The True Definition of a Group That Can Interbreed and Produce Fertile Offspring

Group of members which are morphologically identical but genetically different and belong to different species are termed as (1) Sibling species (2) Taxonomic species (3) Morphospecies (4) Biological species

Sibling Species: Morphologically Identical but Genetically Distinct Species

Bacteria cannot be classified as separate species by the biological species concept because they (1) Generally asexually reproducing organisms (2) High growth rate (3) Exhibits little morphological variations (4) Do not have nucleus

Why Bacteria Cannot Be Classified Using the Biological Species Concept

Ernst Meyer is known for (1) Taxonomic classification (2) Biological species concept (3) Five kingdom classification (4) Evolutionary history

Ernst Mayr and the Biological Species Concept: Redefining the Meaning of Species

96. Speciation occurring due to presence of large geographical barrier is termed as (1) Allopatric                                                  (2) Sympatric (3) Parapatric                                                 (4) Peripatric

Allopatric Speciation: How Large Geographical Barriers Drive the Formation of New Species

95.Most of new species are formed by the process of- (1) Anagenesis                                               (2) Sympatric speciation (3) Cladogenesis                                             (4) Convergent evolution

Cladogenesis: The Primary Process Behind the Formation of Most New Species

Type of speciation observed in slow moving organisms is (1) Sympatric (2) Parapatric (3) Allopatric (4) Peripetric

Peripatric Speciation: The Dominant Mode of Speciation in Slow Moving Organisms

The mode of speciation in single lineage in which species diverge in spurts of relatively rapid change which result in increase in species is termed as- (1) Punctuated equilibrium (2) Adaptive radiation (3) Anagenesis (4) Cladogenesis zy

Punctuated Equilibrium: How Species Diverge in Rapid Evolutionary Spurts

91. Biological species are defined on basis of- (1) Morphology (2) Alkaloids (3) Anatomy (4) Reproductive isolation

How Are Biological Species Defined? The Role of Reproductive Isolation in Species Classification

When new species evolve in contiguous, yet spatially segregated habitats, such a speciation is termed as- (1) Sympatric (2) Allopatric (3) Allo-sympatric (4) Parapatric

Parapatric Speciation: How New Species Evolve in Contiguous, Spatially Segregated Habitats

Morphologically similar but reproductively isolated species are termed as (1) Sibling species (2) Non-sibling species (3) Sympatric (4) Parapatric

Sibling Species: Morphologically Similar but Reproductively Isolated Species Explained

Biological species concept cannot be applied on (1) Parthengenetic species (2) Sympatric species (3) Species producing viable hybrids (4) Species of aquatic ecosystem

Why the Biological Species Concept Cannot Be Applied to Parthenogenetic Species

The formation of 2 species from one parent population due to geographical isolation will be termed as- (1) Allopatric speciation (2) Sympatric speciation (3) Parapatric speciation (4) Peripatric speciation

Allopatric Speciation: How Geographical Isolation Leads to the Formation of New Species

The wings of insects and the wings of bats represent a case of (1) divergent evolution (2) convergent evolution (3) parallel evolution. (4) neutral evolution.

Wings of Insects and Bats: A Definitive Example of Convergent Evolution

83. Fore limb of human and flippers of whale are embryologically homologous structures. What does the study of homologous structures tell us about evolution? A. This is the example of adaptive radiation, occurred due to similar group of organisms inhabiting different environments B. This is the example of divergent evolution, occurred due to similar group of organisms inhabiting different environments C. Similar group of organisms with mutations and variations getting naturally selected in different environments D. This is the example of convergent evolution, occurred due to similar group of organisms inhabiting different environments Which of the following is the correct combination? (1) A, B and C (2) A and D (3) B and D (4) Only D

What Homologous Structures Like Human Forelimbs and Whale Flippers Reveal About Evolution

Explore the key features of homologous characters in evolutionary biology and discover which statement about them is NOT true. Learn how homology differs from analogy and why structural similarity matters.

What Is NOT True About Homologous Characters? Understanding Homology in Evolution

Why Flufftails on Pacific Islands Show Low Tail Colour Variation: Explanations and Exceptions

Wings of insects and birds have become flat, large and stream lined, due to common requirement of flight. This is an example of (1) Convergent evolution (2) Parallel evolution (3) Divergent evolution (4) Co-evolution

Insect and Bird Wings: A Prime Example of Convergent Evolution Driven by Flight Adaptations

Insect wing and bird wings are example of (1) Coevolution (2) Convergent evolution (3) Divergent evolution (4) Parallel evolution

Insect Wings and Bird Wings: A Classic Example of Convergent Evolution

In several populations, each of size N =20, if genetic drift results in a change in the relative frequencies of alleles, A. What is the rate of increase per generation in the proportion of populations in which the allele is lost or fixed? B. What is the rate of decrease per generation in each allele frequency class between 0 and 1? The correct answer for A and B is: (1) A-0.25, B-0.125 (2) A-0.025, B-0.0125 (3) A-0.0125, B-0.025 (4) A-0.125, B-0.25

Genetic Drift in Small Populations: Rates of Allele Fixation and Loss per Generation

75. One hundred Independent populations of Drosophila are established with 10 individuals in each population, of which, one individual is of Aa genotype and the other nine are of AA genotype. If random genetic drift is the only mechanism acting on these populations, then, after a large number of generations, the expected number of populations fixed for the "a" allele is (1) 75 (2) 50 (3) 25 (4) 5

Genetic Drift and Allele Fixation: Predicting Outcomes in Small Drosophila Populations

In very small populations, genetic variation is often lost through genetic drift. If the population size of a mammal on an isolated island is 50, what percentage of its genetic variation is lost every generation? (1) 0.01 (2) 0.5 (3) 0.1 (4) 0.05

How Much Genetic Variation Is Lost Each Generation in a Small Isolated Population?

From population dynamics point of view, what would be the effective population size of a population of 150 breeding females and 50 breeding males? (1) 200 (2) 100 (3) 150 (4) 50

How to Calculate Effective Population Size: Example with 150 Breeding Females and 50 Breeding Males

What will be the approximate effective population size in a panmicitic population of 240 with 200 females and 40 polygamous males? (1) 160 (2) 133 (3) 63 (4)67

How to Calculate Effective Population Size in Panmictic Populations: Example with 200 Females and 40 Polygamous Males

Effective population size for polygamous species having 40 males and 10 females would be (1) 40 (2) 32 (3) 20 (4) 10

Calculating Effective Population Size in Polygamous Species: Example with 40 Males and 10 Females

The following statements describe the outcomes of genetic drift: A. Genetic drift can eliminate alleles. B. Genetic drift can be associated with population bottleneck. C. Genetic drift is not observed in populations that increase in size, once they grow through a bottleneck. D. Genetic drift can be associated with founder effect. Which one of the following combinations represents all correct statements? (1) A, B and C (2) B, C and D (3) A, Band D (4) A, C and D

Genetic Drift Outcomes: Understanding the Correct Effects and Associations

Following are key points about the effect of genetic drift: A. Genetic drift is significant in small populations. B. Genetic drift can cause allele frequencies to change in a pre-directed way. C. Genetic drift can lead to a loss of genetic variation within populations. D. Genetic drift can cause harmful alleles to become fixed. Which one of the following combination of the above statements are true? (1) A and B only (2) A and C only (3) A, B and C (4) A, C and D

Genetic Drift: Identifying the True Effects on Populations

Which of the following statements is NOT correct regarding effect of genetic drift? (1) It alters allele frequency substantially only in small population. (2) It can cause allele frequencies to change at random. (3) It can lead to a loss of genetic variation within populations. (4) It can cause harmful alleles to become eliminated.

Genetic Drift: Understanding Its True Effects on Allele Frequencies and Genetic Variation

Twenty small populations of a species, each polymorphic for a given locus (T, t) were bred in captivity. In 10 of them the population size was kept constant by random removal of individuals, while other 10 were allowed to increase their population size. After several generations it was observed that in 7 of the size restricted populations only T was present, in the remaining 3 only t was observed. The experiment illustrates (1) Genetic drift which is more likely in large populations. (2) Genetic drift which is more likely in small populations (3) Density dependent selection against T. (4) Density dependent selection against t.

Genetic Drift in Small Populations: Insights from Captive Breeding Experiments

66. Northern elephant seal had been reduced to about 20 in 1800s. Biologist studied variation in protein in the species. They found no genetic differences in the protein among individuals. This lack of variation is due to (1) the fact that elephant seal lives in constant environment where there was no need for genetic variation (2) population bottle neck and genetic drift (3) natural selection resulting in a single best genotype (4) a very low rate of mutation

How the Bottleneck Effect and Genetic Drift Led to Low Genetic Variation in Northern Elephant Seals

Which Factor Is Least Responsible for Genetic Drift? Exploring the Key Drivers of Random Genetic Change

64. In a massive earthquake on island only few related species of lizards survived and occupied the island. The phenomenon is also referred as (1) Founder effect (2) Bottle Neck effect (3) Vodka-Bertoni effect (4) Darwin's effect

Which statement is NOT true regarding genetic drift as an evolutionary force? (1) It is significant in small population (2) It generates variance in population (3) It leads to fixation of alleles (4) Brings change in allele frequency

Genetic Drift: Myths and Facts About Its Role in Evolutionary Change

Genetic Drift occurs by (1) Chance (2) Immigration (3) Emigration (4) Mutation

Genetic Drift: How Chance Drives Random Changes in Population Genetics

Random change of gene frequency in a population is termed as- (1) Genetic drift (2) Gene flow (3) Mutation (4) Evolution

Genetic Drift: The Role of Random Changes in Gene Frequency in Population Genetics

Abrupt changes in gene frequency in a small population is termed as (1) Gene migration (2) Genetic drift (3) Gene flow (4) Gene fluctuation

Genetic Drift: The Cause of Abrupt Changes in Gene Frequency in Small Populations

Disaster such as earthquake or fire may reduce the size of population drastically and the genetic make up of the small surviving population is unlikely to be representative of make up of original population the situation is termed as- (1) Bottle neck effect (2) Adaptive radiation (3) Founder effect (4) Gene migration

Bottleneck Effect: How Natural Disasters Drastically Alter Genetic Diversity in Populations

Abrupt change in gene frequency of small population is termed as- (1) Genetic loss (2) Genetic erosion (3) Founders effect (4) Genetic load

Founder Effect: Understanding Abrupt Changes in Gene Frequency in Small Populations

Consider an autosomal locus with two alleles A1 and A2 at frequencies of 0.6 and 0.4 respectively. Each generation, A1 mutates to A2 at a rate of µ = 1 x 10⁻⁵ while A2 mutates to A1 at a rate of u = 2 x 10⁻⁵. Assume that the population is infinitely large and no other evolutionary force is acting. The equilibrium frequency of allele A1 is (1) 1.0. (2) 0.5. (3) 0.67 (4) 0.33

How to Calculate Equilibrium Allele Frequency Under Bidirectional Mutation

56. In a plant species, a segregating line (one that contains both homozygotes and heterozygotes at a locus) can be made homozygous by repeated selfing for several generations. What is the level of remaining heterozygosity after three generations of selfing, if the level of heterozygosity in generation 'O' is denoted as 1? (1) 0.5 (2) 0.25 (3) 0.125 (4) 0.0625

How Heterozygosity Declines with Selfing: Calculating Remaining Heterozygosity After Three Generations

54. The frequencies of two alleles p and q for a gene locus in a population at Hardy-Weinberg equilibrium are 0.3 and 0.7, respectively. After a few generations of inbreeding, the heterozygote frequency was found to be 0.28, The inbreeding coefficient will be (1) 0.42 (2) 0.28 (3) 0.33 (4) 0.67

How to Calculate the Inbreeding Coefficient from Heterozygote Frequency After Inbreeding

Discover which statement about genetic variation, genetic drift, genetic load, and inbreeding depression in small populations is incorrect. Learn the facts behind genetic erosion and population genetics.

Which Statement About Genetic Variation and Small Populations Is Incorrect

Which one of the following will have the least impact on allele frequencies in small populations? (1) Inbreeding (2) Random mating (3) Genetic drift (4) Outbreeding

Which Factor Has the Least Impact on Allele Frequencies in Small Populations? Understanding Evolutionary Forces

Which one of the following does NOT contribute to micro-evolutionary change? (1) Mutation (2) Random mating (3) Genetic drift (4) Natural selection

Which Process Does Not Cause Microevolutionary Change? Understanding the Role of Random Mating

Micro-evolution is the term used for changes in allele frequencies that occur over time. A) Within a population at species level B) within a community at genus level C) due to appearance of new genes infections D) due to mutation, natural selection, flow and genetic drift Which of the following combinations is NOT appropriate? (1) A and C (2) A and D (3) B and C (4) B and D

Understanding Microevolution: What It Is and What It Is Not

The inbreeding coefficient of offspring on marriage between brother and sister siblings will be (1) 0.5 (2) 0.05 (3) 0.25 (4) 0.75

Inbreeding Coefficient for Sibling Marriages: Understanding Genetic Risk in Populations

Small amount of lethal mutation always tend to remain in population is due to (1) Mutation-Selection balance (2) Frequency dependent selection (3) Positive selection (4) Negative selection

Why Lethal Mutations Persist: The Role of Mutation-Selection Balance in Population Genetics

Which of the following DO NOT bring variation in population? (1) Random drift (2) Random matting (3) Mutation (4) Natural Selection

Which Factors Do Not Bring Variation in Populations? Understanding the Role of Random Mating

Transovarial transmission (TOT) is a widespread and efficient process through which pathogens of plants can be passed between generations of arthropod vectors. During evolution host plant will become (1) Resistance (2) Susceptible (3) Kill pathogen                              (4) Cannot be predicted

Transovarial Transmission in Plant Pathogens: Will Host Plants Evolve Resistance or Susceptibility?

In a population a single gene locus has two alleles ’A’ and 'a' with allele frequency of 'a'= 0.3. If genotype 'Aa' is lethal and only individual with genotype ‘AA’ and 'aa' are favored then over several generation (1) Allele frequency will be 1:1 (2) Allele frequency will remain same to that of present (3) Allele 'a' would be lost from population (4) Population will disrupt into two new species

What Happens When a Lethal Heterozygote Genotype Exists? The Fate of Allele Frequencies in a Population

When an allele changes frequency not because it itself is under natural selection, but because it is near another gene that is undergoing a selective sweep and that is on the same DNA chain is termed as (1) Selective drive (2) Evolutionary drive (3) Hitch hiking (4) Linkage

Genetic Hitchhiking: How Linked Genes Ride the Wave of Natural Selection

The phenomenon of the non-random association of alleles at different loci in a given population, where the frequency of association of their different alleles is higher or lower than what would be expected if the loci were independent and associated randomly is termed as (1) Linkage equilibrium (2) Linkage disequilibrium (3) Epitasis (4) Polygenic Inheritance

Understanding Linkage Disequilibrium: Non-Random Association of Alleles in Populations

Fruit colour of wild Solanum nigrum is controlled by two alleles of a gene (A and a). The frequency of A, p=O.8 and a, q=O.2. In a neighbouring field a tetraploid genotype of S. nigrum was found. After critical examination five distinct genotypes found; which are AAAA, AAAa, AAaa, Aaaa and aaaa. Following Hardy Weinberg principle and assuming the same allelic frequency as that of diploid population the numbers of phenotypes calculated within a population of 1000 plants are close to one of the following: AAAA : AAAa : AAaa : Aaaa ; aaaa (1) 409 :409:154:26:2 (2) 420: 420: 140: 18: 2 (3) 409:409:144:36:2 (4) 409: 420 144: 25: 2

Calculating Tetraploid Genotype Frequencies in Solanum nigrum Using Hardy-Weinberg Principles

Colour blindness affects approximately 1 in 12 men (8%). In a population that is in Hardy-Weinberg Equilibrium (HWE) where 8% of men are colour-blind due to a sex-linked recessive gene. What proportion of women are expected to be carriers? (1) 0.92 (2) 0.85 (3) 0.78 (4) 0.15

How to Calculate the Carrier Frequency of Colour Blindness in Women Using Hardy-Weinberg Equilibrium

Sampling of 200 persons for their ABO blood group was done from an urban area. The types of blood group observed in the given population are as follows: A = 60, B = 32, AB = 10 and O = 98 Which of the following gives the correct frequency of blood group determining alleles lA, lB and lO in the given population? (1) lA = 0.19, lB = 0.11, lO = 0.7 (2) lA = 0.27, lB = 0.63, lO = 0.09 (3) lA = 0.16, lB = 0.14, lO = 0.7 (4) lA = 0.38, lB = 0.22, lO = 0.7

How to Calculate ABO Blood Group Allele Frequencies from Population Data

If a given gene in a randomly mating population has three alleles a, b and c in the ratio of 0.5, 0.2 and 0.3 respectively, what is the expected frequency of genotypes ab and bc in the population at equilibrium? (1) 0.1 and 0.06 (2) 0.2 and 0.15 (3) 0.2 and 0.12 (4) 0.04 and 0.09

How to Calculate Genotype Frequencies for Three Alleles Using Hardy-Weinberg Equilibrium

An autosomal recessive condition affects 1 newborn in 10,000 in a random mating population without any disruptive acting force. What is the approximate expected frequency of carriers in this population? (1) 1 in 1000 newborns (2) 1 in 500 newborns (3) 1 in 100 newborns (4) 1 in 50 newborns

How to Calculate Carrier Frequency for an Autosomal Recessive Condition: A Hardy-Weinberg Approach

In a population of 2000 individuals of a plant species, genetic difference at a single locus leads to different flower colours. The alleles are incompletely dominant. The population has 100 individuals with the genotype rr (white flowers), 800 individuals with the genotype Rr (pink flower) and the remaining have genotype RR (red flowers). What is the frequency of the r allele in the population? (1) 0.25 (2) 0.50 (3) 0.75 (4) 1.00

How to Calculate the Frequency of the r Allele in a Plant Population with Incomplete Dominance

36. In a sample from a population there were 65 individuals with BB genotype, 30 individuals with Bb genotype and 15 individuals with bb genotype. The frequency of the 'b' allele is (1) 0.59 (2) 0.27 (3) 0.41 (4) 0.73

How to Calculate the Frequency of the ‘b’ Allele from Genotype Data in a Population

How to Calculate Allele Frequencies from Homozygote Frequency in Hardy-Weinberg Equilibrium

In a population that is in Hardy-Weinberg equilibrium, the frequency of the recessive homozygote genotype of trait q is 0.04. The percentage of individuals homozygous for the dominant allele is (1) 64 (2) 40 (3) 32 (4) 16  

How to Calculate the Percentage of Homozygous Dominant Individuals Using Hardy-Weinberg Equilibrium

How to Calculate the Expected Number of Heterozygotes in a Hardy-Weinberg Population Sample

In a population, alleles p and q are known to be in a ratio of 0.7p: 0.3q. At Hardy- Weinberg equilibrium how many heterozygotes (pq) can be expected in a sample of 60? (1) 25 (2) 42 (3) 49 (4) 9

How to Calculate the Number of Heterozygotes in a Hardy-Weinberg Population Sample

30. In a population that is in a Hardy-Weinberg equilibrium, 40% of the plants are recessive homozygotes and produce white flowers (WF). If the total number of individuals in the population is 14000 plants, the numbers of homozygous dominant red flowered (RF) plants and heterozygous pink flowered (PF) plants would be: (1) RF-5600 PF-1891 (2) RF-1891 PF-6508 (3) RF-5600 PF-6508 (4) RF-5145 PF-8855

Calculating Genotype Numbers in a Hardy-Weinberg Population: Red, Pink, and White Flowered Plants

in a random sample of 400 individuals from a population with allele of trait in Hardy-Weinberg equilibrium, 36 individuals are homozygous for allele α. How many individuals in the sample are expected to carry atleast one allele A? (1) 36 (2) 168 (3) 364 (4) 196

How to Calculate the Number of Individuals Carrying At Least One Dominant Allele Using Hardy-Weinberg Equilibrium

28. Red hair is a recessive trait in human. In a randomly mating population in Hardy-Weinberg equilibrium approximately 9% of individuals are red- haired. What is the frequency of the heterozygotes? (1) 81% (2) 49% (3) 42% (4) 18%

How to Calculate the Frequency of Heterozygotes for Red Hair Using Hardy-Weinberg Equilibrium

There are 'n' numbers of alleles at a given locus in a diploid population. The proportion of all homozygotes in the population (A) All alleles are equal abundant (B) All alleles are not in equal abundant (1) 1/n and 1/n (3) 1/n2 and 1/n2

Calculating the Proportion of Homozygotes for Multiple Alleles in a Diploid Population

In a population, the genotype frequencies are: f(A1A1) = 0.59; f(A1A2) = 0.16; f(A2A2) = 0.25. What are the frequencies of the two alleles at this locus? (1) A1=0.59 A2=41 (2) A1=0.75 A2=25 (3) A1=0.67 A2=33 (4) A1=0.55 A2=44

How to Calculate Allele Frequencies from Genotype Data: Step-by-Step Hardy-Weinberg Example

How to Calculate Allele Frequency and Expected Genotype Numbers: A Step-by-Step Guide

The frequency of M-N blood types in a population of 6129 individuals is as follows: The frequency of LN allele in this population is (1) 0.4605 (2) 0.2121 (3) 0.5395 (4) 0.2911

How to Calculate the LN Allele Frequency in an M-N Blood Type Population

A scientist is using the Hardy-Weinberg equation to assess if a population is in equilibrium or is evolving. She recorded the following characteristics for this population: A. The size of the population is very large. B. Individuals are randomly mating. C. Individuals are under natural selection. D. New alleles are added to the population through migration and dispersal. E. Mutation rates are high. Which one of the following options contains all INCORRECT characteristics of a population in Hardy- Weinberg equilibrium? (1) A and D (2) C, D and E (3) A, B and C (4) B and E

Which Characteristics Are Incorrect for Hardy-Weinberg Equilibrium? Understanding Population Genetics Assumptions

The Hardy-Weinberg principle states that allele frequencies in a population will remain constant over generations if certain assumptions are met. A. Random mating B. Mate choice C. Small population size D. Large population size E. Lack of mutations F. Directional selection Which of the above factors will cause changes in allele frequencies over generations? (1) A, D and F (2) B, D and F (3) A, C and E (4) B, C and F

Which Factors Cause Changes in Allele Frequencies? Understanding Hardy-Weinberg Equilibrium Disruptions

The Hardy-Weinberg principle comes from considering what happens when Mendelian genes act on population. The model predicts that there will be no change in allele frequencies when (1) Migration into the population occurs at a steady rate (2) The population suffers a bottle neck (3) a rare new mutation is associated with a sharp increase in fitness (4) no evolutionary process is at work

Hardy-Weinberg Principle: When Will Allele Frequencies Remain Constant in a Population?

Which of the following assumption support the Hardy-Weinberg Equilibrium? (1) Presence of Natural Selection (2) Random mating. (3) Genetic Drift. (4) Assortative mating

Which Assumption Supports Hardy-Weinberg Equilibrium? Understanding the Role of Random Mating

Which of the following is NOT an assumption of the Hardy-Weinberg model? (1) Population mates at random with respect to the locus in question (2) Selection is not acting on the locus in question. (3) One allele is dominant and other is recessive at this locus (4) The population is effectively infinite in size

Which Is NOT an Assumption of the Hardy-Weinberg Model? Clarifying Key Population Genetics Concepts

Under which condition Hardy-Weinberg law will NOT operate? (1) 3 alleles are involved (2) Alleles are X-linked (3) Skewed sex ratio (4) Population is tetraploid

When Does the Hardy-Weinberg Law NOT Apply? Understanding the Limits of Genetic Equilibrium

Among the following which is not an assumption of Hardy-Weinberg rule (1) Small population size (2) Random mating (3) No natural selection (4) No mutation

Which Is NOT an Assumption of the Hardy-Weinberg Rule? Understanding Population Genetics Foundations

A population of 200 is in Hardy-Weinberg equilibrium with allele frequency of 'A' = 0.7 and 'a' 0.3. The number of carriers in population will be (1) 18 (2) 42 (3) 84 (4) 98

Calculating the Number of Carriers in a Population Using Hardy-Weinberg Equilibrium

In a population with two alleles 'B' and 'b' having allele frequency 0.7 and 0.3 in Hardy-Weinberg equilibrium, how many individuals in a sample of 250 can be expected to be heterozygous (Bb)? (1) 52 (2) 105 (3) 21 (4) 42

Calculating the Number of Heterozygous Individuals Using Hardy-Weinberg Equilibrium

Frequency of blood group O in population is 25% and allele for Blood group A and B are equally frequent. What would be the ratio of Allele frequency between blood group O, A and B (1) 1:1:1 (2) 2:1:1 (3) 1:2:2 (4) 3:1:1

How to Calculate Allele Frequency Ratios for ABO Blood Groups: Understanding O, A, and B Distribution

13. In a population frequency of A1 is 0.75 and A2 is 0.25. After one generation of random matting, the genotype frequency of A1 A1, A1 A2 and A2 A2 respectively will be (1) 0.5625; 0.375; 0.0625 (2) 0.5625; 0.0625; 0.375 (3) 0.750; 0.250; 0.350 (4) 0.5625; 0.1525; 0.0625

Calculating Genotype Frequencies After One Generation of Random Mating: Hardy-Weinberg Application

If organism is triploid, then Hardy-Weinberg theorem applicable for genotype frequency will be (1) (p+q)3=1 (2) (p+q+r)=1 (3) (p+q+r)3=1 (4) (p+q+r)2=1

Hardy-Weinberg Theorem for Triploid Organisms: Understanding Genotype Frequencies

'p' and 'q' in Hard-Weinberg equation for equilibrium population represents (1) Genotype frequency (2) Allele frequency (3) Heterozygote frequency (4) Homozygote frequency

What Do ‘p’ and ‘q’ Represent in the Hardy-Weinberg Equation? Understanding Allele Frequencies

If the frequency of recessive allele causing disease in homozygous recessive condition in a population of 10,000 is 0.04, then the number people affected by disease will be (1) 16 (2) 400 (3) 3600                                                        (4) 496

Calculating the Number of Individuals Affected by a Recessive Disease Using Hardy-Weinberg Law

In a population obeying Hardy-Weinberg equilibrium, the frequency of recessive allele is 0.88, while of dominant allele us 0.12. The frequency of heterozygotes in population will be- (1) 11.1 % (2) 21.1% (3) 79.9 % (4) 14.4%

Calculating Heterozygote Frequency in Hardy-Weinberg Populations: Step-by-Step Guide

Consider alleles 'A' and 'a' in a population. The frequency of heterozygotes will be highest when: (1) Frequency of 'A' is more than frequency of 'a' (2) Frequency of 'A' is less than frequency of 'a' (3) Frequency of 'A' is equal to frequency of 'a' (4) Frequency of 'A' and 'a' affects the frequency of homozygotes, not heterozygotes

When Is Heterozygosity Highest? Understanding Allele Frequencies and Heterozygote Proportions

If a gene have a three alleles namely p, q, r. Then Hardy- Weinberg law can be represented as- (1) (p+q+r)2 (2) (p+q+r)3 (3) (p+q+r) (4) (P+q)2

Hardy-Weinberg Law for Three Alleles: The Trinomial Expansion Explained

Hardy Weinberg law operates on- (1) Non-evolving population (2) Slow evolving population (3) Random evolving population (4) Fast evolving population

Hardy-Weinberg Law: Why It Applies Only to Non-Evolving Populations

In a population frequency of a homozygous recessive disease is 16% then the frequency of dominant allele would be (1) 0.84 (2) 0.6 (3) 0.16 (4) 0.4

How to Calculate the Frequency of a Dominant Allele from Homozygous Recessive Disease Prevalence

Hardy Weinberg law helps in detecting- (1) Allele frequency (2) Outbreeding (3) Genetic drift (4) Inbreeeding

How the Hardy-Weinberg Law Helps Detect Allele Frequencies in Populations

If frequency of one allele is 0.2 and another is 0.8 then number of homozygotes in population of 250 is (assume that population is in Hardy-Weinberg equilibrium)? (1) 32 (2) 10 (3) 40 (4) 170

Calculating Homozygotes in a Hardy-Weinberg Population: Step-by-Step Guide

Hardy Weinberg law is applicable on (1) Large random matting population (2) Evolving population (3) Population reproducing by asexual mode (4) Where there is mutation and migration but no natural

Hardy-Weinberg Law: Applicability and Essential Conditions in Population Genetics

All alleles of mendelian population makes- (1) Genome (2) Gene pool (3) Genotype (4) Alleles

What Do All Alleles of a Mendelian Population Make? Understanding the Gene Pool

Latest Courses