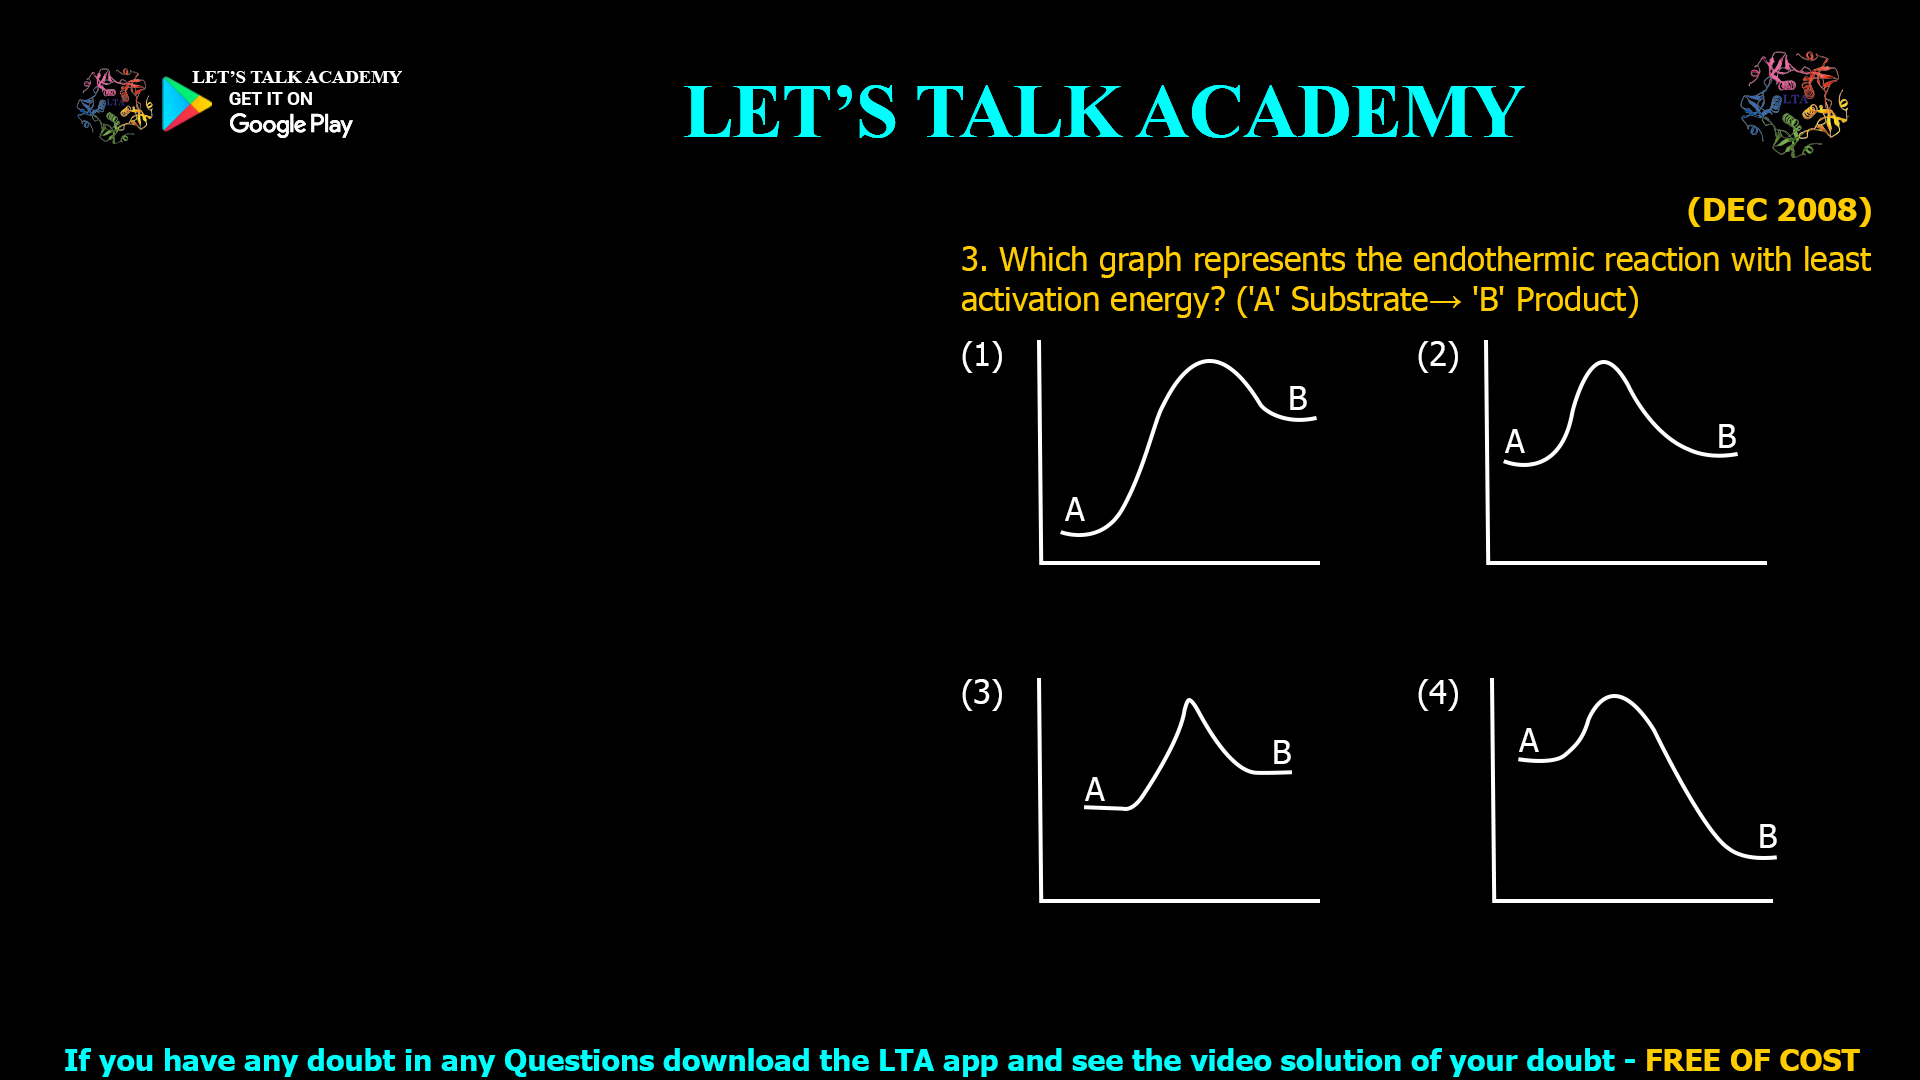
3. Which graph represents the endothermic reaction with least activation energy? (‘A’ Substrate→ ‘B’ Product)
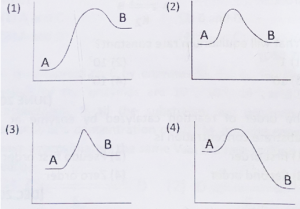
The correct answer is Option 3. This graph best represents an endothermic reaction with the least activation energy where ‘A’ (substrate) transitions to ‘B’ (product).
Introduction
Understanding how to analyze energy diagrams is essential in biochemistry, enzymology, and exam preparation for tests like CSIR NET Life Sciences. Recognizing endothermic reactions with the least activation energy helps clarify enzyme action, metabolic pathways, and reaction engineering principles for students and educators alike. This guide breaks down every detail you need for academic success, using the examination question above for focused clarity.
Energy Diagrams: Basics and Importance
Chemical reactions involve breaking old bonds and forming new ones. Every reaction moves from reactant(s) to product(s), but the energy changes during the process dictate reaction speed, feasibility, and thermodynamic nature.
-
Reactants (Substrate, A): The starting point.
-
Products (B): The endpoint after the reaction.
-
Activation Energy (Ea): The minimum energy required to reach the transition state.
-
Endothermic Reaction: Final product energy is higher than substrate energy. Heat is absorbed.
-
Exothermic Reaction: Final product energy is lower. Heat is released.
Endothermic Reactions: Characteristics
In an endothermic reaction:
-
The product (B) has higher energy than the substrate (A).
-
The graph moves upward from A to B.
-
Common examples include photosynthesis, certain metabolic synthesis steps, and melting ice.
Activation Energy: Concepts and Calculations
Activation energy (Ea) is the energy difference between the substrate (A) and the peak (transition state) in an energy profile. Lower activation energy leads to faster reactions, often catalyzed by enzymes.
Calculation
Ea=Etransition state−Esubstrate
Least activation energy means the gap between A and the peak is lowest among all diagrams.
Analyzing Each Option
Let’s analyze each provided graph for:
-
Endothermic shift (Product energy > Substrate energy)
-
Least activation energy (Lowest peak above A)
| Option | Endothermic? | Activation Energy | Suitable Graph? |
|---|---|---|---|
| 1 | Yes (B > A) | Large | No |
| 2 | Yes (B > A) | Large | No |
| 3 | Yes (B > A) | Least | Yes |
| 4 | No (B < A) | Not relevant | No |
Option 3 shows A (substrate) at lower energy, B (product) at higher energy, but the energy peak is closest to A, confirming the “least activation energy”.
Detailed Explanation of Option 3
-
The curve starts with A, rises gently to a low transition state, and ends at B, which is above A.
-
Since the peak is close to A, activation energy required is lowest among all graphs.
-
The final position (B) is clearly higher than initial (A), consistent with endothermic reactions.
Why Not Other Options?
-
Option 1 and Option 2: Both are endothermic but have a higher activation energy, as the peaks are much farther from A.
-
Option 4: Represents an exothermic reaction since B is below A, not endothermic.
Principles of Reaction Energy and Biological Significance
Many biological reactions are endothermic, particularly anabolic processes, e.g., gluconeogenesis, protein synthesis. Enzymes vastly reduce activation energy, allowing such reactions to occur quickly under physiological conditions.
Role of Enzymes
-
Enzymes lower activation energy (Ea), making difficult reactions proceed efficiently.
-
Graphically, the enzyme-catalyzed reaction would have a lower peak compared to uncatalyzed reactions.
Thermodynamics and Kinetics in Energy Diagrams
-
Endothermic reactions are thermodynamically uphill.
-
Activation energy relates to the rate of reaction: lower activation energy increases reaction velocity.
-
Transition state theory helps explain how molecular collisions and configurations dictate the required energy for reaction events.
Visualization and Practical Examples
-
Photosynthesis: Sunlight provides the energy to lift the energy state of reactants to the products.
-
ATP Synthesis: The synthesis from ADP and phosphate is endothermic and requires energy input.
Graphing these reactions follows the same energy diagram logic outlined in the question, where reactants start low, climb to the transition state, and end at a higher product energy.


49 Comments
Roopal Sharma
September 12, 2025Endothermic reaction – higher energy product than substrate .and least activation energy means peak between a and b is low
Neha Yadav
September 12, 2025Option c
In this activation energy is lower and peak (energy) of B is more than the A
Aakansha sharma Sharma
September 12, 2025Endothermic Reaction: Final product energy is higher than substrate Energy so .option 3 shows A (substrate) at lower energy, B (product) at higher energy, but the energy peak is closest to A, confirming the “least activation energy”.
Priya dhakad
September 12, 2025Endothermic rxn -Final product energy is higher than substrate, endothermic reaction with the least activation energy shows A(substrate)at lower energy and B (product) at higher energy but the energy peak is closest to A .
Sakshi Kanwar
September 12, 2025Wider the peak of the graph high the activation energy required to convert A into B ….so graph 3 represents less activation energy
Mohd juber Ali
September 12, 2025Endothermic rexn mean final product energy is higher than substrate energy in option 3 least activation energy ( A substart ➡️ B producat)
The product (B) has higher energy than the substrate (A) least activation energy mean energy peak close to A
Option A and B also endothermic but product B has higher energy so peak further from A
Heena Mahlawat
September 12, 2025Graph 3 represents least activation energy where substrate A coverts into product B
Mansukh Kapoor
September 12, 2025The correct answer is graph 3rd
Varsha Tatla
September 12, 2025Graph 3rd gives best explanation for endothermic reaction
Here activation energy of product is more then substrate bcz heat absorb by product
Tanvi Panwar
September 12, 2025In endothermic reaction final product energy is higher as energy is absorbed so option C is correct and also the activation energy in option C is near to A which means the activation energy is low.
HIMANI FAUJDAR
September 12, 2025Ans correct graph is 3 , because substrate A show at lower energy, B (product) at higher energy, but the energy peak is closest to A, confirming the least activation energy.
Kanica Sunwalka
September 13, 2025graph 3 represents endothermic rxn with least Ea
product have high energy than substrate
( heat is absorbed )
Kirti Agarwal
September 13, 2025Graph 3 show least activation energy
Sakshi yadav
September 13, 2025Graph 3 show less activation energy
Nilofar Khan
September 13, 2025Correct answer is 3 .
Endothermic Reaction: Final product energy is higher than substrate Energy
Least activation energy means energy peak close to substrate A
Soniya Shekhawat
September 13, 2025Endothermic reaction means as a final product energy is be higher then substrate energy and low activation energy means energy peak between substrate and product is low or near to each other.
Manisha choudhary
September 13, 2025Endothermic reaction m product ki energy jyada hoti h substrate s
Product substrate s above hota h endothermic reaction m energy absorption hota h
Least activation energy m substrate and transition state k bich energy gap km hota h
Ayush Dubey
September 13, 2025Option 3 shows A (substrate) at lower energy, B (product) at higher energy, but the energy peak is closest to A, confirming the “least activation energy
Deepika sheoran
September 14, 2025Option 3rd correct
Graph 3 show less Activation energy.
Pratibha Jain
September 14, 2025Correct option is option (3)
In endothermic reaction final product energy is higher as energy is absorbed so option C is correct and also the activation energy in option C is near to A which means the activation energy is low.
Aafreen Khan
September 14, 2025In endothermic reaction final product energy is higher than substrate energy and least activation energy means peak is close to A
Dharmpal Swami
September 14, 2025Endothermic rex.= Final product energy is higher
Least activation energy=peak close
Avni
September 14, 2025Option 3 shows A at lower energyand B at higher energy i.e. endothermic reaction, but the energy peak is closest to A so least activation energy
Khushi Agarwal
September 14, 2025Option C is correct answer
the endothermic reaction with least activation energy bcz final position (B) is clearly higher than initial (A), consistent with endothermic reactions.
Vanshika Sharma
September 14, 2025Opt c is correct graph
Anjali
September 14, 2025The correct answer is 3
Varsha Kanwar shishodiya
September 14, 2025Option 3. This graph best represents an endothermic reaction with the least activation energy where ‘A’ (substrate) transitions to ‘B’ (product).
Anurag Giri
September 14, 2025The correct answer is Option 3. This graph best represents an endothermic reaction with the least activation energy where ‘A’ (substrate) transitions to ‘B’ (product)
Mitali saini
September 14, 2025The correct answer is Option 3. This graph best represents an endothermic reaction with the least activation energy where ‘A’ (substrate) transitions to ‘B’ (product).
Rishita
September 14, 2025Done sir 👍🏻
Arushi Saini
September 14, 2025Endothermic reaction means energy of product is higher then the energy of subtrate
Asha Gurzzar
September 14, 2025Option c will be right
Pallavi Ghangas
September 14, 2025Least gap between substrate and peak depicts activation energy, lower the activation energy fast the reaction
anjani sharma
September 14, 2025Option c
Endothermic Reaction- Final product energy is higher than substrate Energy
Least activation energy means energy peak close to substrate
Payal Gaur
September 14, 2025Option 3rd B is more then A but least activation energy
yashika
September 14, 2025Low ea.. B is more than a endothermic
Preeti
September 15, 2025Graph 3 shows least activation energy
Devika
September 15, 20253rd
Surendra Doodi
September 15, 2025The correct answer is Option 3. This graph best represents an endothermic reaction with the least activation energy …
Ajay Sharma
September 15, 2025Option 3 is correct, for endothermic final product energy should be higher than substrate’s , heat absorbed and vice versa in exothermic in exothermic energy is released
Khushi Vaishnav
September 15, 2025Option 3 because endothermic reaction with the least activation energy where ‘A’ (substrate) transitions to ‘B’ (product).
Anjana sharma
September 16, 2025Option 3
Minal Sethi
September 16, 2025graph 3 because in endothermic reaction product absorbs energy so have higher energy than reactant
Yogita
September 16, 2025Option 3 because endothermic reaction with the least activation energy
Muskan singodiya
September 16, 2025Option 3
Monika jangid
September 17, 2025Option 4 endothermic rxn shoelw least activation energy
Muskan Yadav
September 17, 2025Option 3 is the correct answer shows A (substrate) at lower energy, B (product) at higher energy, but the energy peak is closest to A, confirming the least activation energy.
Priti khandal
September 17, 2025C is right
Bhavana kankhedia
September 18, 2025endothermic reaction with the least activation energy where ‘A’ transitions to ‘B’