- Values of Tm (midpoint of denaturation), ΔHm (enthalpy change at Tm) and ΔCP (constant-pressure heat capacity change) of a protein are measured in a differential scanning calorimeter. ΔGD(T), the Gibbs free energy change at any temperature T(K) can be estimated using the following form of the Gibbs-Helmholtz equation with the values obtained from these
measurements:The stability curve for the protein simulated using the observed thermodynamic values is given below:
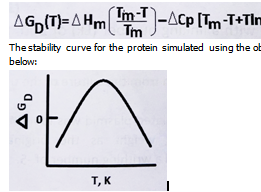
The shape of the stability curve is due to
(1) hydrogen-bonding and electrostatic interactions only.
(2) van der Waals and electrostatic interactions only.
(3) only electrostatic interactions.
(4) only hydrophobic interaction.
Introduction
Proteins are essential biological macromolecules whose function depends critically on their three-dimensional folded structure. Understanding protein stability—the balance between folded and unfolded states—is fundamental in biochemistry and molecular biology. One powerful method to probe protein stability is differential scanning calorimetry (DSC), which measures thermodynamic parameters such as the midpoint of denaturation (Tm), enthalpy change (ΔHm), and heat capacity change (ΔCp). These parameters help generate a protein stability curve, depicting the Gibbs free energy change (ΔGD) as a function of temperature.
A key question is: What molecular interactions govern the characteristic shape of this stability curve? This article delves into the thermodynamic basis of protein stability curves and explains why hydrophobic interactions dominate their shape, surpassing other forces like hydrogen bonding, electrostatics, and van der Waals interactions.
Protein Stability Curves: Overview
The protein stability curve plots the Gibbs free energy difference between folded and unfolded states (ΔGD) against temperature. Typically, this curve has an inverse bell shape, indicating that proteins are most stable at an intermediate temperature range and tend to unfold at both low and high temperatures.
The shape of this curve reflects the temperature dependence of the folding equilibrium, influenced by enthalpic and entropic contributions, and especially by the heat capacity change (ΔCp) upon unfolding.
Molecular Forces Influencing Protein Stability
Protein folding and stability arise from a delicate balance of several non-covalent interactions:
-
Hydrophobic interactions: The tendency of nonpolar amino acid side chains to avoid water and cluster inside the protein core.
-
Hydrogen bonding: Interactions between backbone and side chain polar groups stabilizing secondary and tertiary structures.
-
Electrostatic interactions: Salt bridges and charge-charge interactions contributing to specificity and stability.
-
van der Waals forces: Weak, short-range attractions between closely packed atoms.
Each of these forces contributes to the overall folding free energy, but their relative influence varies.
Why Hydrophobic Interactions Shape the Stability Curve
Studies quantifying the contributions of these interactions reveal:
-
Hydrophobic effect contributes approximately 60% of the total protein stability.
-
Hydrogen bonding contributes about 40%, while electrostatic and van der Waals interactions play supportive roles.
-
The temperature dependence of hydrophobic interactions is significant because the ordering of water molecules around nonpolar groups changes with temperature, strongly affecting ΔCp and thus the stability curve shape.
The burial of hydrophobic residues during folding reduces the system’s heat capacity, leading to the characteristic inverse bell-shaped stability curve observed in DSC experiments.
Role of Thermodynamic Parameters (Tm, ΔHm, ΔCp)
-
Tm (melting temperature): The temperature at which half of the protein population is unfolded.
-
ΔHm (enthalpy change at Tm): Reflects the heat absorbed during unfolding.
-
ΔCp (heat capacity change): Indicates the difference in heat capacity between folded and unfolded states, largely influenced by hydrophobic surface exposure.
Using the Gibbs-Helmholtz equation, these parameters allow calculation of ΔGD at any temperature, reproducing the stability curve shape. The large ΔCp is primarily due to hydrophobic interactions, emphasizing their role in temperature-dependent stability.
Why Other Interactions Are Less Influential in Curve Shape
-
Hydrogen bonding stabilizes the folded structure but is less temperature-dependent.
-
Electrostatic interactions contribute to specificity but are weaker overall and less responsible for the heat capacity changes.
-
van der Waals forces are important for packing but have minimal effect on ΔCp.
Thus, while these interactions are essential for protein structure and function, they do not primarily determine the shape of the stability curve.
Practical Implications
Understanding that hydrophobic interactions dominate the protein stability curve helps in:
-
Protein engineering: Designing mutations to enhance stability by optimizing hydrophobic core packing.
-
Drug design: Targeting hydrophobic pockets to modulate protein function.
-
Biophysical studies: Interpreting calorimetric data to infer folding mechanisms.
Conclusion
The characteristic shape of the protein stability curve observed in differential scanning calorimetry is mainly shaped by hydrophobic interactions. These interactions dominate the temperature-dependent changes in heat capacity and folding free energy, overshadowing hydrogen bonding, electrostatic, and van der Waals forces in determining protein thermal stability.
Keywords
protein stability curve, hydrophobic interactions, differential scanning calorimetry, Gibbs free energy, melting temperature, enthalpy change, heat capacity change, protein folding thermodynamics, hydrogen bonding, electrostatic interactions, van der Waals forces, protein thermal stability
Correct answer:
(4) only hydrophobic interaction. -