
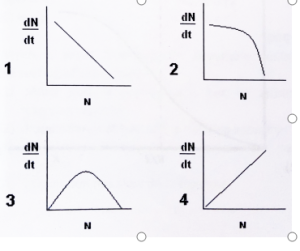
- Which of the following curves represents the generalrelationship between population size (N) and growthrate (dN/dt) for logistically growing population?v
Introduction
Population growth is a fundamental concept in ecology, and understanding how growth rate changes with population size is essential for predicting the fate of species in nature. Unlike exponential growth, where populations can increase indefinitely, logistic growth accounts for environmental limits. But what does the relationship between population size (N) and growth rate (dN/dt) look like for a population growing logistically? The answer lies in a distinctive curve that reveals the dynamics of real-world populations.
The Logistic Growth Model Explained
The logistic growth model is defined by the equation:
dNdt=rN(1−NK)
-
N = population size
-
r = intrinsic rate of increase
-
K = carrying capacity (the maximum population the environment can sustain)
This equation describes how growth rate is not constant but instead depends on how close the population is to its carrying capacity.
The Bell-Shaped Curve: N vs. dN/dt
When you plot growth rate (dN/dt) on the Y-axis against population size (N) on the X-axis for a logistically growing population, the result is a bell-shaped curve.
Why a Bell-Shaped Curve?
-
At low N: Growth rate is low because there are few individuals to reproduce.
-
As N increases: Growth rate rises, reaching a peak when the population is at half the carrying capacity (N=K/2).
-
As N approaches K: Growth rate declines, eventually reaching zero as the population hits the carrying capacity.
This pattern occurs because, at low densities, there aren’t enough individuals to maximize population growth. At high densities, resource limitations and competition slow growth. The sweet spot—maximum growth rate—is at intermediate population sizes.
Key Features of the Curve
-
Starts at zero when N=0 (no individuals, no growth).
-
Peaks at N=K/2 (maximum growth rate).
-
Returns to zero at N=K (carrying capacity reached, growth stops).
This bell-shaped curve is a hallmark of the logistic growth model and distinguishes it from the straight-line relationship seen in exponential growth.
Visual Summary
| Population Size (N) | Growth Rate (dN/dt) | Description |
|---|---|---|
| 0 | 0 | No individuals, no growth |
| Increases | Increases | More individuals, faster growth |
| K/2 | Maximum | Peak growth rate |
| Approaches K | Decreases | Resource limits slow growth |
| K | 0 | Carrying capacity, growth stops |
Real-World Examples
-
Yeast in a test tube: Growth accelerates as the population builds, peaks midway, and slows as nutrients run out.
-
Wild animal populations: Deer, seals, and other species often show this pattern as their numbers rise, resources become scarce, and growth levels off.
Why This Curve Matters
Understanding this relationship helps ecologists and resource managers predict when populations will grow fastest, when they’ll start to slow, and how environmental changes might shift the carrying capacity.
Conclusion
The general relationship between population size (N) and growth rate (dN/dt) for a logistically growing population is best represented by a bell-shaped curve. This curve captures the reality of limited resources and competition, providing a realistic model for most natural populations.


3 Comments
Manisha choudhary
October 13, 20253 is correct answer
Kajal
November 14, 2025Option 3is correct
Sakshi Kanwar
November 29, 2025Graph 3