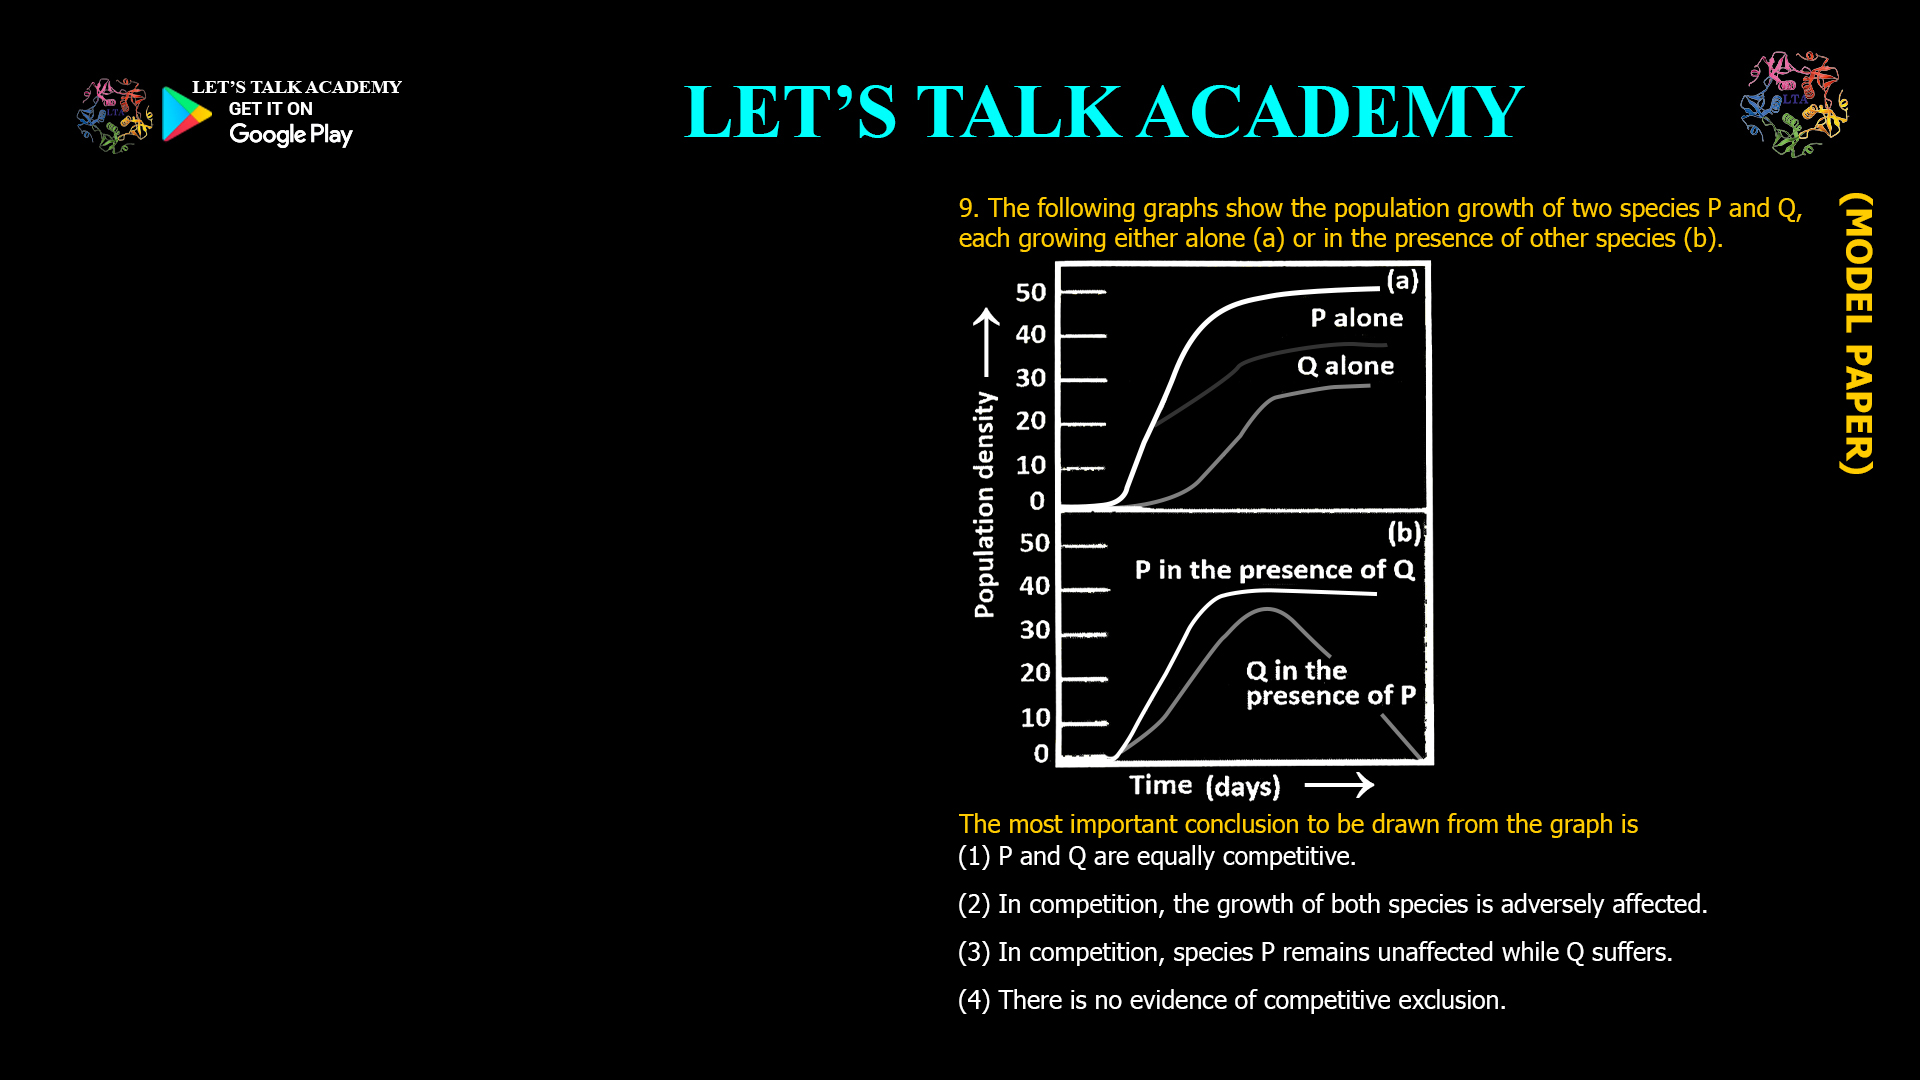
- The following graphs show the population growth of two species P and Q, each growing either alone (a) or in the presence of other species (b).
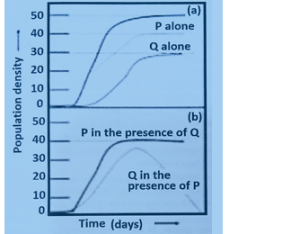
The most important conclusion to be drawn from the graph is
(1) P and Q are equally competitive.
(2) In competition, the growth of both species is adversely affected.
(3) In competition, species P remains unaffected while Q suffers.
(4) There is no evidence of competitive exclusion.Understanding how species interact and compete for resources is a cornerstone of ecology. When two species occupy similar niches and compete for the same limited resources, their population dynamics can reveal much about the nature of their interaction. Population growth graphs—showing each species growing alone and together—are classic tools for visualizing these effects.
The Experimental Setup
Imagine two species, P and Q. Their population growth is monitored under two conditions:
-
Alone: Each species grows in isolation, with no competition.
-
Together: Both species grow in the same environment, competing for the same resources.
The resulting graphs typically show higher population sizes when species grow alone, and reduced population sizes when grown together.
What Do the Graphs Reveal?
When both species are grown together and both show lower population sizes compared to when grown alone, this is direct evidence that competition is adversely affecting both. This scenario is a classic demonstration of interspecific competition, where both species suffer reduced growth rates due to limited resources136.
Key Points:
-
Reduced growth for both: Both P and Q have lower population sizes in the presence of each other.
-
No evidence of one-sided effect: If only one species was affected, the graph would show one species maintaining its population while the other declines.
-
No competitive exclusion observed: If one species was driven to extinction, we would see its population drop to zero, but if both persist at lower numbers, exclusion has not occurred26.
The Principle Behind the Graph: Competitive Exclusion
The competitive exclusion principle (Gause’s law) states that two species competing for the same limiting resource cannot coexist indefinitely at constant population values. Usually, one species will eventually outcompete the other, leading to local extinction or niche differentiation1236. However, in many experiments and natural scenarios, both species may persist but at reduced population sizes due to competition.
Evaluating the Options
Let’s match the conclusions to the graph:
-
P and Q are equally competitive.
The graph alone cannot determine if they are equally competitive unless their population reductions are identical, which is rarely the main takeaway. -
In competition, the growth of both species is adversely affected.
This is the most accurate and general conclusion, as both species experience reduced growth when together. -
In competition, species P remains unaffected while Q suffers.
This would be seen if P’s population stayed the same in both conditions, which is not the typical result in competitive scenarios. -
There is no evidence of competitive exclusion.
While true if both persist, the main conclusion is the mutual adverse effect, not the absence of exclusion.
Correct answer: (2) In competition, the growth of both species is adversely affected.
Why This Matters
Recognizing the impact of competition on population growth helps ecologists:
-
Predict outcomes of species introductions or invasions.
-
Understand the structure and dynamics of natural communities.
-
Develop conservation and management strategies for endangered species.
Conclusion
Population growth graphs showing both species with reduced growth in the presence of each other provide clear evidence that competition adversely affects both species. This finding is a foundational concept in ecology and illustrates the importance of resource limitation and interspecific interactions in shaping the natural world.
ShareExportRewrite -


3 Comments
Manisha choudhary
November 6, 2025In competition, the growth of both species is adversely affected.
Kajal
November 8, 2025Option 2
Sakshi Kanwar
November 27, 2025In competition, the growth of both species is adversely affected.