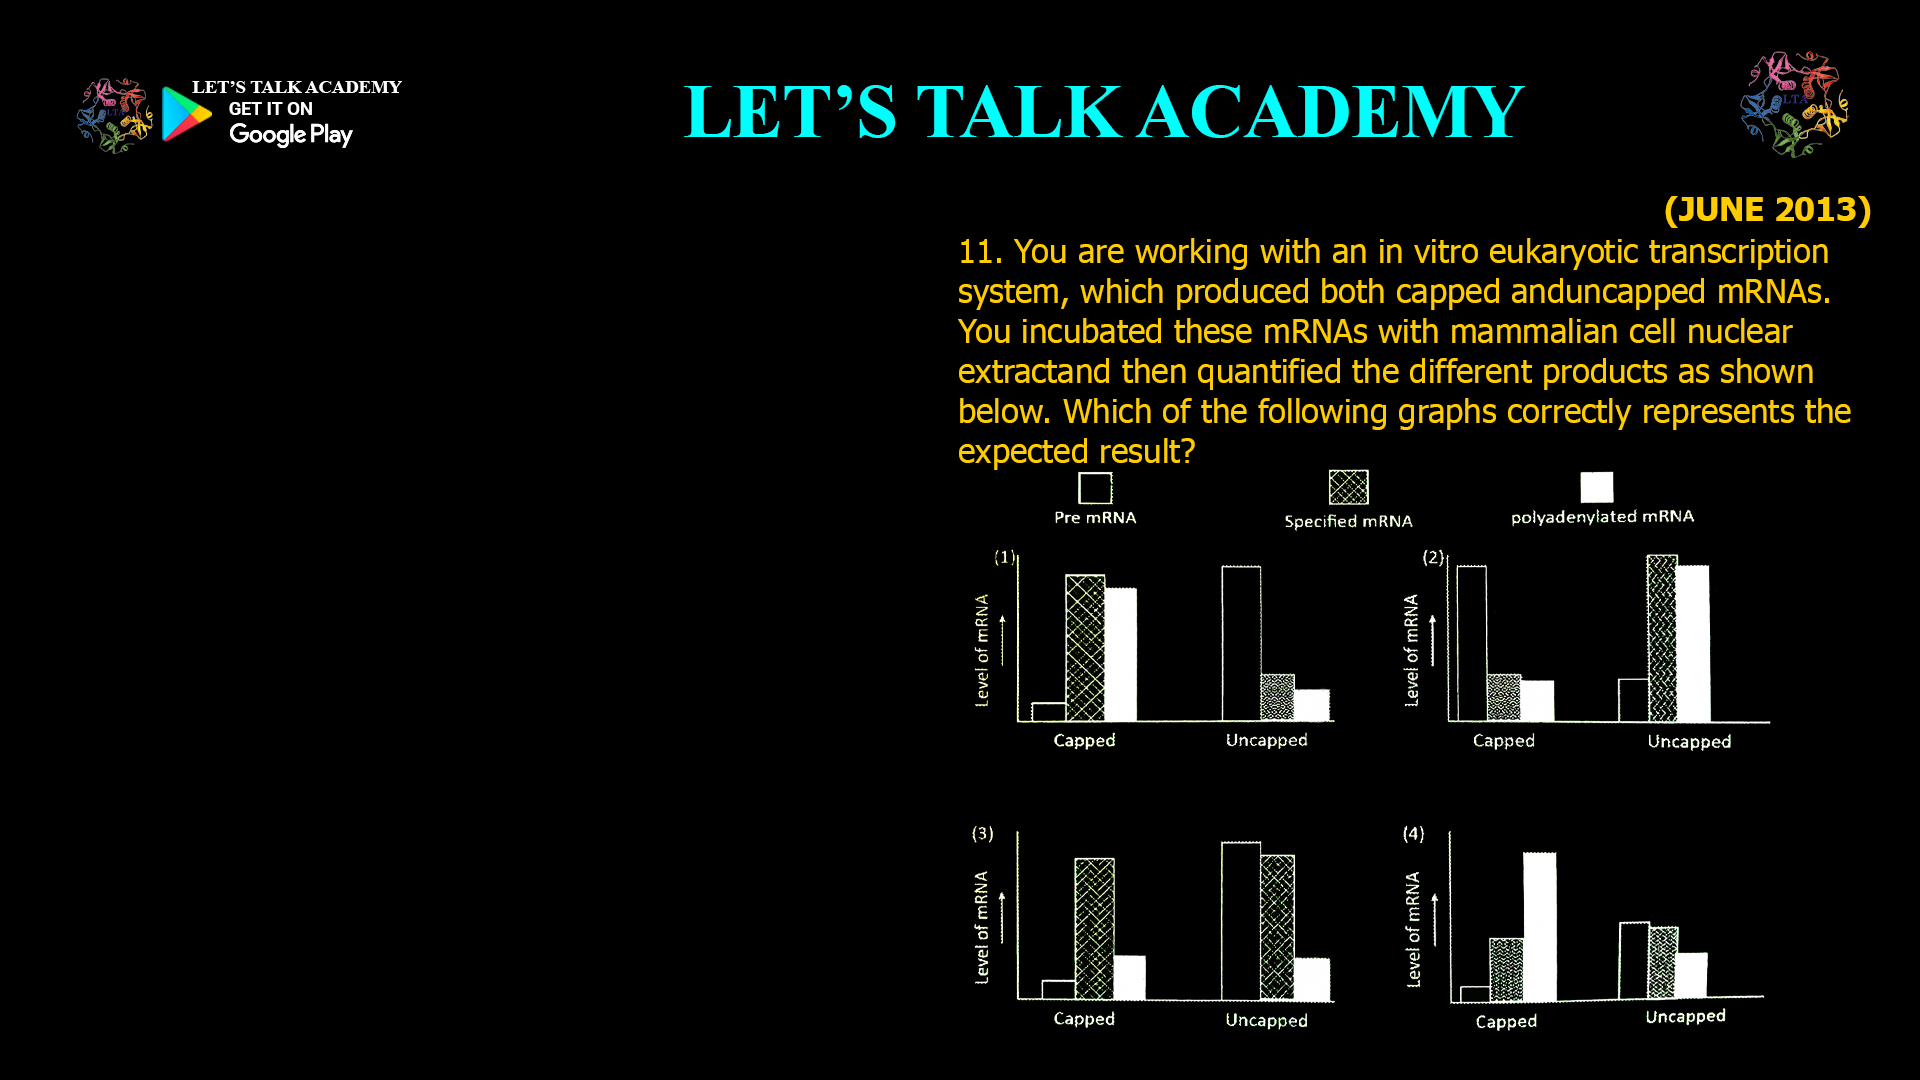
11. You are working with an in vitro eukaryotic transcription system, which produced both capped and uncapped mRNAs. You incubated these mRNAs with mammalian cell nuclear extract and then quantified the different products as shown below. Which of the following graphs correctly represents the expected result?

In an in vitro eukaryotic transcription system producing both capped and uncapped mRNAs, when these mRNAs are incubated with mammalian cell nuclear extract, the expected outcome relates to the efficiency of splicing and stability of the transcripts.
Key Points on Capped vs. Uncapped mRNAs in Nuclear Extracts
-
Capped mRNAs carry a 5′ methylated guanosine cap (m7G), which is crucial for mRNA stability, efficient splicing, and translation initiation. The cap structure promotes the recruitment of splicing factors, especially enhancing the splicing of the 5′-proximal intron in pre-mRNAs.
-
Uncapped mRNAs lack this protective cap, resulting in reduced splicing efficiency, particularly of the upstream intron, and generally lower stability. Although some splicing can still occur, it is significantly less efficient compared to capped mRNAs.
-
Studies show that capped pre-mRNAs are spliced more efficiently than uncapped ones, with the cap structure exerting a positive effect primarily on the 5′-proximal intron.
-
The spliced products from capped mRNAs may degrade faster in nuclei, but the initial splicing efficiency is higher.
Expected Graphical Representation
The graph that correctly represents the expected result would show:
-
A higher amount of spliced products from capped mRNAs over time compared to uncapped mRNAs.
-
A lower amount of unspliced precursor for capped mRNAs, indicating more efficient splicing.
-
For uncapped mRNAs, a higher level of unspliced precursor and lower spliced product accumulation.
-
Possibly, a transient increase in spliced products for capped mRNAs followed by some degradation.
- The correct answer is ONE
Summary
In summary, the graph should depict that capped mRNAs yield significantly more spliced products and less unspliced precursor than uncapped mRNAs when incubated with mammalian nuclear extract. This reflects the critical role of the 5′ cap in enhancing pre-mRNA splicing efficiency in eukaryotic cells.
If you have specific graph options to compare, the correct one will show:
-
Capped mRNA curve: Rapid decrease in unspliced RNA and rapid increase in spliced product.
-
Uncapped mRNA curve: Slower or minimal decrease in unspliced RNA and lower increase in spliced product.
This pattern aligns with the molecular biology of mRNA capping and splicing mechanisms.


7 Comments
Suman bhakar
June 4, 2025Okay sir 👍
Ekta yadav
June 4, 2025👍🏻
Prami Masih
June 7, 2025👍👍
Manisha choudhary
November 4, 2025Graph -1 is correct answer
Heena Mahlawat
November 4, 2025Graph 1
Roopal Sharma
November 4, 2025Graph 1
Sakshi Kanwar
November 8, 2025capped mRNAs yield significantly more spliced products graph 1 st making more stable capped mrna