- In the following diagram, two models succession are represented. In this
diagram A, C and D are species and arrows indicate replaced by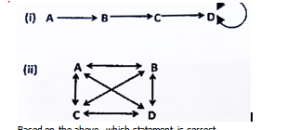
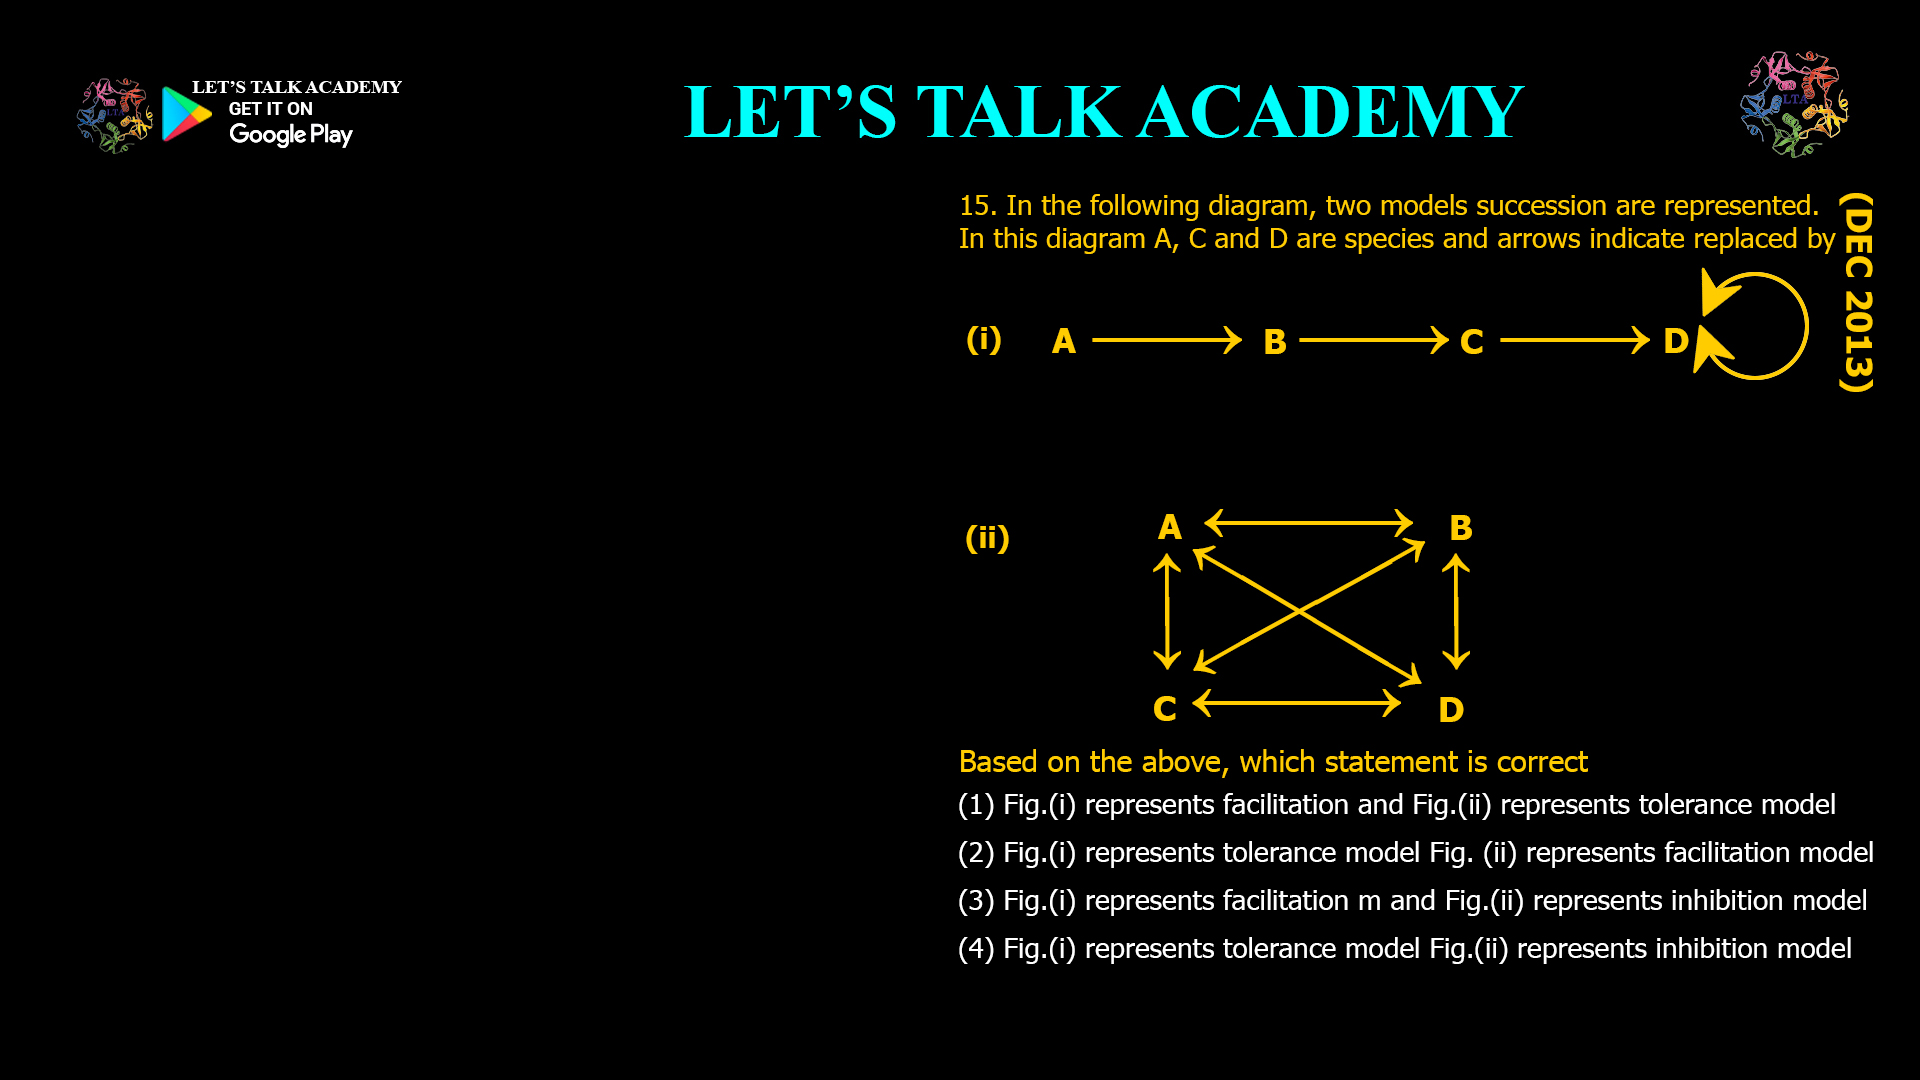
Based on the above, which statement is correct
(1) Fig.(i) represents facilitation and Fig.(ii) represents tolerance model
(2) Fig.(i) represents tolerance model Fig. (ii) represents facilitation model
(3) Fig.(i) represents facilitation m and Fig.(ii) represents inhibition model
(4) Fig.(i) represents tolerance model Fig.(ii) represents inhibition model
Introduction
Ecological succession is the process by which the species composition of a biological community changes over time, leading to increasingly complex and stable ecosystems128. Several models explain how succession unfolds, with the three most widely recognized being facilitation, tolerance, and inhibition. Diagrams are often used to illustrate these models, showing how different species replace one another as the community develops. This article addresses the question: In a diagram where two models of succession are represented, with species A, C, and D and arrows indicating replacement, which statement correctly identifies the models shown? The options are: (1) Fig.(i) represents facilitation and Fig.(ii) represents tolerance model; (2) Fig.(i) represents tolerance model and Fig.(ii) represents facilitation model; (3) Fig.(i) represents facilitation model and Fig.(ii) represents inhibition model; (4) Fig.(i) represents tolerance model and Fig.(ii) represents inhibition model. By explaining each model and how it is typically represented in diagrams, we clarify the correct answer and provide a comprehensive overview of succession models.
Understanding Ecological Succession Models
Ecological succession is driven by interactions between species and their environment, and different models explain how species replace one another over time68. The three main models are:
1. Facilitation Model
In the facilitation model, early species modify the environment in ways that make it more suitable for the establishment of later species. For example, pioneer plants like lichens and mosses break down rock and add organic matter to the soil, creating conditions that allow grasses, shrubs, and eventually trees to establish themselves. In diagrams, this is often shown as a sequence where each species facilitates the arrival of the next, and arrows indicate that one species is replaced by another as the environment changes.
2. Tolerance Model
In the tolerance model, early species do not significantly alter the environment. Instead, the sequence of species replacement is determined by differences in life history traits and tolerance to competition. Later species are able to establish themselves because they can tolerate the existing conditions, regardless of whether those conditions have been improved by earlier species. In diagrams, this is often shown as a sequence where species replace one another without any facilitation or inhibition, simply because some species are better able to tolerate competition.
3. Inhibition Model
In the inhibition model, early species make the environment less suitable for the establishment of later species. This can happen if early species outcompete others for resources, block light, or release chemicals that inhibit the growth of potential competitors. In diagrams, this is often shown as a sequence where early species inhibit the arrival of later species, and replacement only occurs if the inhibiting species are removed by disturbance or death.
Interpreting Succession Diagrams
Diagrams of ecological succession typically use letters (such as A, C, and D) to represent different species and arrows to indicate replacement. The pattern of arrows and the sequence of species can help identify which model is being represented.
Facilitation Model Diagram
-
Pattern:
Species A is replaced by species C, which is then replaced by species D. -
Explanation:
Each species modifies the environment in a way that allows the next species to establish itself. The sequence is orderly and predictable, with each stage preparing the way for the next.
Tolerance Model Diagram
-
Pattern:
Species A is replaced by species C, which is then replaced by species D. -
Explanation:
The sequence appears similar to facilitation, but the key difference is that species replacement is not due to environmental modification. Instead, it is due to differences in tolerance to competition and environmental stress. In practice, diagrams for tolerance and facilitation can look similar, but the underlying mechanism is different.
Inhibition Model Diagram
-
Pattern:
Species A inhibits the establishment of species C and D. Species C or D can only establish themselves if species A is removed. -
Explanation:
Early species prevent the arrival of later species until they are removed by disturbance or death. The sequence is less predictable and depends on external factors.
Analyzing the Options
Given the lack of a specific diagram in the question, we rely on standard representations and the typical patterns described above. The question asks which statement correctly identifies the models shown in the diagrams, with options referencing facilitation, tolerance, and inhibition.
Let’s analyze each option:
1. Fig.(i) represents facilitation and Fig.(ii) represents tolerance model
This option suggests that the first diagram shows a sequence where each species facilitates the next, and the second diagram shows a sequence where species replace one another due to differences in tolerance. This is plausible if the diagrams are interpreted based on standard succession models, but without seeing the actual diagrams, it is difficult to confirm.
2. Fig.(i) represents tolerance model and Fig.(ii) represents facilitation model
This option reverses the order of the models. Unless the diagrams are labeled differently, this is less likely to be correct, as facilitation is usually depicted as a clear sequence of environmental modification and replacement.
3. Fig.(i) represents facilitation model and Fig.(ii) represents inhibition model
This option suggests that the first diagram shows facilitation (orderly replacement with environmental modification), and the second diagram shows inhibition (early species inhibit later species until removed). This is a common way to contrast the two models in educational materials.
4. Fig.(i) represents tolerance model and Fig.(ii) represents inhibition model
This option suggests that the first diagram shows tolerance (replacement due to differences in tolerance), and the second diagram shows inhibition. This is also plausible, but less common in introductory materials, where facilitation and inhibition are often contrasted.
Determining the Correct Answer
Based on standard ecological succession diagrams and the typical patterns described in educational resources68:
-
Facilitation: Orderly sequence of replacement, with each species preparing the environment for the next.
-
Tolerance: Sequence of replacement, but not due to environmental modification; species replace one another based on tolerance to competition.
-
Inhibition: Early species inhibit the establishment of later species until they are removed.
In most educational contexts, diagrams are used to contrast facilitation (orderly, predictable replacement) with inhibition (inhibition until removal), or to show tolerance as a separate, less visually distinct model. Therefore, the most likely correct answer, especially if the diagrams are designed to contrast two distinct models, is:
Fig.(i) represents facilitation model and Fig.(ii) represents inhibition model.
This is because facilitation and inhibition are the most visually and conceptually distinct models, and are often paired in educational diagrams to highlight the differences in how species replace one another.
Why This Distinction Matters
Understanding the differences between facilitation, tolerance, and inhibition is essential for predicting how ecosystems will respond to disturbance, management, and environmental change. These models help ecologists and land managers design strategies for restoration, conservation, and sustainable resource use.
Common Misconceptions
A common misconception is that all species replacement in succession is due to facilitation. In reality, inhibition and tolerance also play important roles, and the sequence of species replacement can be influenced by a combination of these mechanisms.
Conclusion
Based on standard representations and the typical patterns described in ecological succession diagrams, the correct answer is:
Fig.(i) represents facilitation model and Fig.(ii) represents inhibition model.
This pairing best illustrates the contrast between orderly, predictable replacement (facilitation) and inhibition of later species by early ones (inhibition). Understanding these models is essential for anyone studying or managing ecosystems, as they provide insights into how communities develop and change over time.
-


4 Comments
Kirti Agarwal
October 17, 2025Fig 1. Facilitation modle
Fig2. Inhibition modle
Santosh Saini
October 26, 2025The correct answer is fig. (1) Represent facilitation model and fig. A(2) represent inhibition model
Kajal
November 10, 2025Option 3 facilitation and inhibition models are there
Sakshi Kanwar
November 27, 20251 represents facilitation model and 2 represents inhibition model