- Which one of the following curves correctly depicts the relationship of the NPP/GPP ratio with latitude?
(1) A (2) B
(3) C (4) D
Introduction
The ratio of Net Primary Productivity (NPP) to Gross Primary Productivity (GPP) is a key indicator of how efficiently ecosystems convert captured energy into new biomass after accounting for respiration. Understanding how this ratio changes with latitude provides insights into global ecosystem functioning and carbon cycling. In this article, we analyze the provided graph and identify which curve best represents the relationship between the NPP/GPP ratio and latitude.
What Is NPP/GPP Ratio?
-
Gross Primary Productivity (GPP): Total energy captured by plants via photosynthesis.
-
Net Primary Productivity (NPP): Energy remaining after subtracting the energy plants use for their own respiration.
-
NPP/GPP Ratio: Shows what fraction of captured energy is available for growth and consumption by herbivores and decomposers.
How Does NPP/GPP Ratio Vary with Latitude?
-
At the Equator (Low Latitudes):
-
High temperatures lead to high rates of plant respiration.
-
A larger fraction of GPP is lost to respiration, so the NPP/GPP ratio is lower.
-
-
At Higher Latitudes (Towards the Poles):
-
Cooler temperatures reduce respiration rates.
-
A greater fraction of GPP remains as NPP, so the NPP/GPP ratio increases.
-
Therefore, the NPP/GPP ratio generally increases as you move from the equator towards the poles.
Analyzing the Curves
Let’s interpret the curves from the provided image:
-
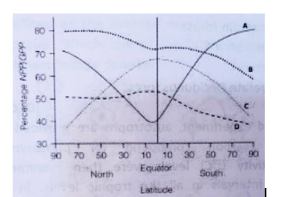
Curve A:
-
Starts moderate at the northern high latitudes, dips at the equator, then rises sharply towards the southern high latitudes.
-
This curve shows the NPP/GPP ratio is lowest at the equator and highest at the poles.
-
-
Curve B:
-
Shows a gentle decline from north to south, peaking near the equator.
-
-
Curve C:
-
Peaks at the equator, dips at both poles.
-
-
Curve D:
-
Shows a steady decline from north to south.
-
Based on ecological understanding, the correct pattern is lowest NPP/GPP at the equator and highest at the poles—matching Curve A.
Why Does Curve A Fit the Global Pattern?
-
Tropical regions: High temperatures and high respiration → lower NPP/GPP.
-
Temperate and polar regions: Cooler temperatures, lower respiration → higher NPP/GPP.
-
Therefore, Curve A accurately reflects the increase in NPP/GPP ratio with latitude.
Conclusion
Curve A correctly depicts the relationship of the NPP/GPP ratio with latitude, showing that the ratio is lowest at the equator and increases towards both the northern and southern poles. This trend is driven by the balance between photosynthesis and plant respiration, which is strongly influenced by temperature.
Summary Table
Curve Pattern Across Latitudes Correct? A Lowest at equator, highest at poles Yes B Gently declines from north to south No C Highest at equator, lowest at poles No D Steady decline from north to south No
Correct Answer:
(1) A -


2 Comments
Kirti Agarwal
November 10, 2025Curve A
Kajal
November 10, 2025Curve A bcz increase as moving from equator towards poles