Which of the following equations best represents the graph shown below?
Y = X2
Y = ex
Y = logX
Y = X1/2
Which Equation Shows a Graph Starting Near Zero and Increasing Exponentially?
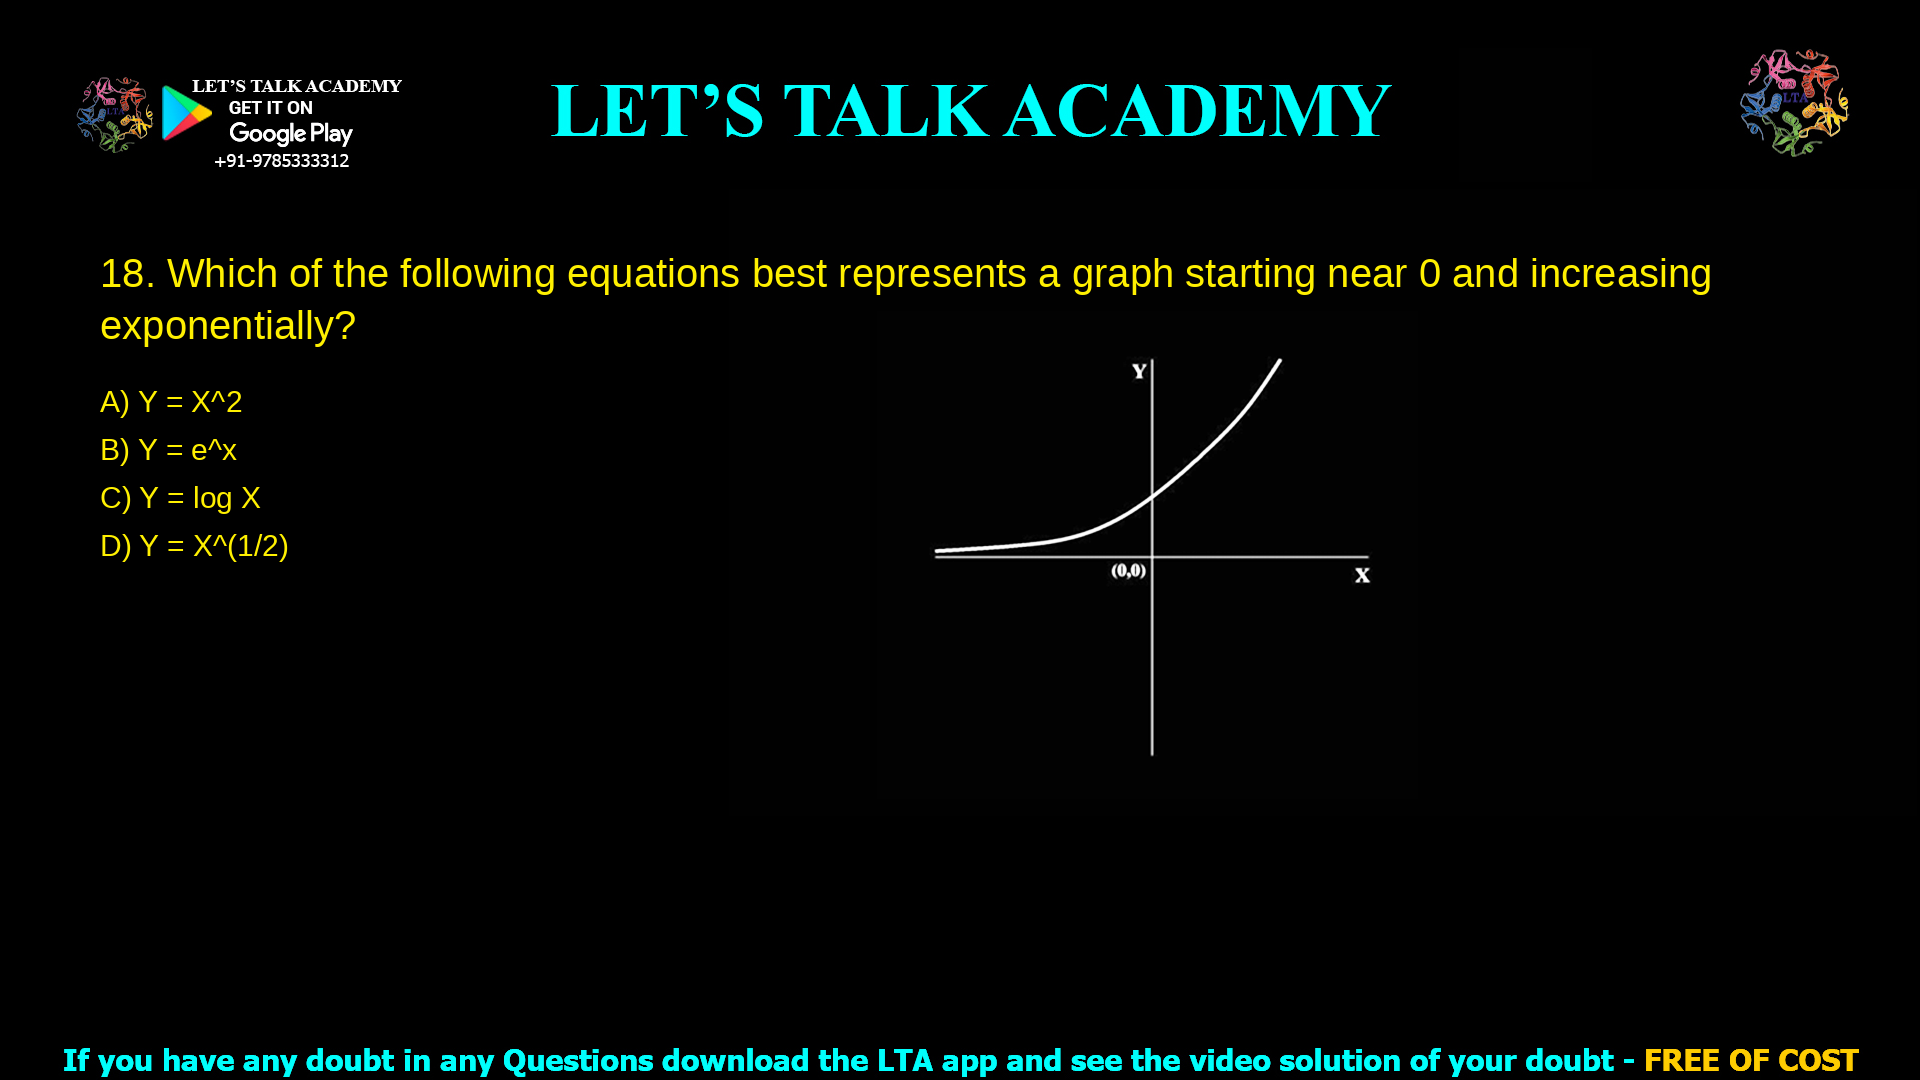
Which of the following equations best represents a graph starting near 0 and increasing exponentially?
- A) Y = X²
- B) Y = ex
- C) Y = log X
- D) Y = X1/2
Correct Answer:
Option B: Y = ex
Why?
The function Y = ex represents exponential growth. It starts very small when x is negative, passes near (0,1), and then rises very rapidly as x increases. This matches the graph shown — starting low and increasing exponentially.
Explanation of Each Option
Option A: Y = X²
This is a quadratic function. It increases faster than a linear function but does not show exponential growth. It forms a parabola opening upward.
Option C: Y = log X
This is a logarithmic function. It rises quickly for small X but then flattens out. It does not represent exponential growth and is not defined at or below zero.
Option D: Y = X1/2
This is a square-root function. It increases slowly with a flatter curve, not rapid exponential growth.
Summary Table
| Option | Equation Type | Growth Behavior | Matches Graph? |
|---|---|---|---|
| A | Quadratic | Polynomial growth | ❌ No |
| B | Exponential | Rapid rise after near-zero start | ✔️ Yes |
| C | Logarithmic | Rises quickly then slows | ❌ No |
| D | Radical | Slow increasing curve | ❌ No |
Final Conclusion
The only equation that starts near zero and rises quickly like the graph is:
🔥 Option B — Y = ex


