
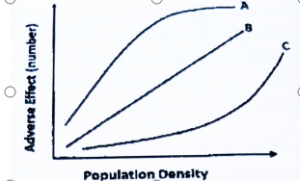
- An observation was made on a species experiencing three factors A, B and C in order to infer a density dependent population regulation by a factor. The following graph shows the relationship between the adverse effect of the factors in terms of number and population density.
Based on the above observation, which of the following is correct?
(1) A – Density independent; B = Density dependent; C – Inversely density dependent
(2) A – Inversely density dependent; B- Density independent; C – Density dependent
(3) A – Density dependent; B = Inversely density independent; C – Density independent
(4) A – Density dependent; B = Density independent; C – Inversely density dependent
Introduction
Population regulation is a cornerstone of ecology, helping us understand how animal and plant numbers fluctuate in nature. Scientists use graphs to study the effects of different factors on population density. These factors can be density-dependent, density-independent, or inversely density-dependent. Knowing how to identify each type is crucial for interpreting ecological data and managing wildlife populations.
Types of Population Regulation Factors
Density-dependent factors increase their effect as population density rises. Examples include competition, predation, and disease. These factors help stabilize populations by increasing mortality or reducing birth rates at higher densities.
Density-independent factors affect populations regardless of their density. These are typically abiotic, such as extreme weather, natural disasters, or pollution. Their impact is the same whether the population is large or small.
Inversely density-dependent factors have a greater effect at low population densities. For instance, certain types of predation or difficulties in finding mates can disproportionately affect sparse populations, sometimes leading to population crashes or extinction.
Interpreting the Graph
If you observe a graph showing the adverse effect of three factors (A, B, and C) in relation to population density:
-
A curve that increases with density: This is density-dependent—the effect intensifies as the population grows.
-
A flat line, unaffected by density: This is density-independent—the effect is constant, no matter the population size.
-
A curve that decreases with density: This is inversely density-dependent—the effect is strongest at low densities and weakens as density increases.
Correct Answer and Explanation
Given the options and standard ecological definitions:
(4) A – Density dependent; B = Density independent; C – Inversely density dependent
-
A: The effect of the factor increases as population density increases, matching the definition of a density-dependent factor (e.g., competition, disease).
-
B: The effect remains constant regardless of population density, which is characteristic of density-independent factors (e.g., weather, natural disasters).
-
C: The effect is strongest at low population densities and decreases as density increases, which defines an inversely density-dependent factor (e.g., Allee effect, mate limitation).
Why This Matters
-
Ecological Management: Recognizing these relationships helps manage wildlife, conserve endangered species, and control pests.
-
Population Stability: Density-dependent factors stabilize populations, while density-independent and inversely density-dependent factors can cause dramatic fluctuations.
-
Conservation: Understanding the Allee effect (a type of inverse density dependence) is vital for preventing population collapse in small or endangered populations.
Conclusion
When interpreting population regulation graphs, remember:
-
Density-dependent effects increase with population density.
-
Density-independent effects remain constant across densities.
-
Inversely density-dependent effects are strongest at low densities.
The correct interpretation for the graph described is:
-
A: Density dependent
-
B: Density independent
-
C: Inversely density dependent
This classification is foundational for understanding and managing population dynamics in ecology.


3 Comments
Manisha choudhary
October 16, 20251st is correct answer
Kajal
November 13, 2025Option 4 is correct
Sakshi Kanwar
November 29, 2025A – Density dependent; B = Density independent; C – Inversely density dependent.