
70 The correclining exponentially under depleting t graphical representation of a bacteria decnutrient condition is
Introduction
Bacterial growth and decline are fundamental concepts in microbiology and ecology. While much attention is given to the rapid multiplication of bacteria in nutrient-rich environments, understanding what happens when nutrients are depleted is equally important. Under such conditions, the bacterial population doesn’t just slow—it often declines exponentially. This article explores the graphical representation of this decline, the science behind it, and its significance in research and industry.
The Bacterial Growth Curve: A Quick Overview
Bacterial populations in a closed system (like a flask or petri dish) typically follow a four-phase growth curve:
-
Lag Phase: Cells adapt to their environment, but population size remains stable.
-
Exponential (Log) Phase: Cells divide rapidly, and population size increases exponentially.
-
Stationary Phase: Growth slows as nutrients become limited and waste accumulates; births equal deaths.
-
Death Phase: Nutrients are exhausted, and waste products accumulate, leading to an exponential decline in population.
Exponential Decline: The Death Phase Explained
When bacteria enter the death phase due to nutrient depletion, the number of living cells decreases rapidly. This decline is not linear—it follows an exponential decay pattern. In this phase:
-
The population halves at regular intervals (if, for example, half the cells die every hour).
-
The rate of decline is proportional to the current population size: the more bacteria there are, the faster the decline.
Mathematical Model
The exponential decay of a bacterial population can be expressed as:
N(t)=N0⋅at
Where:
-
N(t) = number of bacteria at time t
-
N0 = initial population at the start of decline
-
a = decay factor (a<1)
-
t = time
Graphical Representation
What Does the Curve Look Like?
-
Y-axis: Number of bacteria (N)
-
X-axis: Time (t)
-
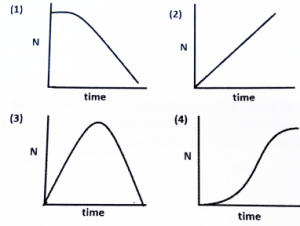
Curve Shape: The graph starts at a high value and curves downward steeply, approaching the X-axis but never touching it. This is the classic exponential decay curve.
Key Features
-
Rapid initial decline: Most cells die quickly when nutrients are first depleted.
-
Gradual leveling: As the population shrinks, the rate of decline slows, but the population never truly reaches zero.
-
Horizontal asymptote: The curve approaches, but does not cross, the X-axis (N=0).
Real-World Example
Suppose a bacterial culture starts with 1,000,000 cells. After nutrients are depleted, the population is halved every hour:
-
0 hours: 1,000,000 cells
-
1 hour: 500,000 cells
-
2 hours: 250,000 cells
-
3 hours: 125,000 cells
-
…and so on.
Plotting these points produces a smooth, downward-sloping exponential curve.
Why Is This Important?
-
Biotechnology & Industry: Predicting bacterial decline helps in designing sterilization protocols and controlling contamination.
-
Medicine: Understanding decay curves is crucial for determining the effectiveness of antibiotics and disinfectants.
-
Ecology: Exponential decline models are used to study population crashes in natural and artificial ecosystems.
Conclusion
The correct graphical representation of a bacterial population declining exponentially under depleting nutrient conditions is a downward-curving exponential decay graph. This curve is characterized by a rapid initial drop in population, which slows over time but never quite reaches zero. Recognizing and interpreting this curve is vital for microbiologists, ecologists, and anyone working with microbial systems.


3 Comments
Manisha choudhary
October 14, 20251st is correct answer
Kajal
November 13, 2025Option 1 is correct
Sakshi Kanwar
November 29, 2025Graph 1