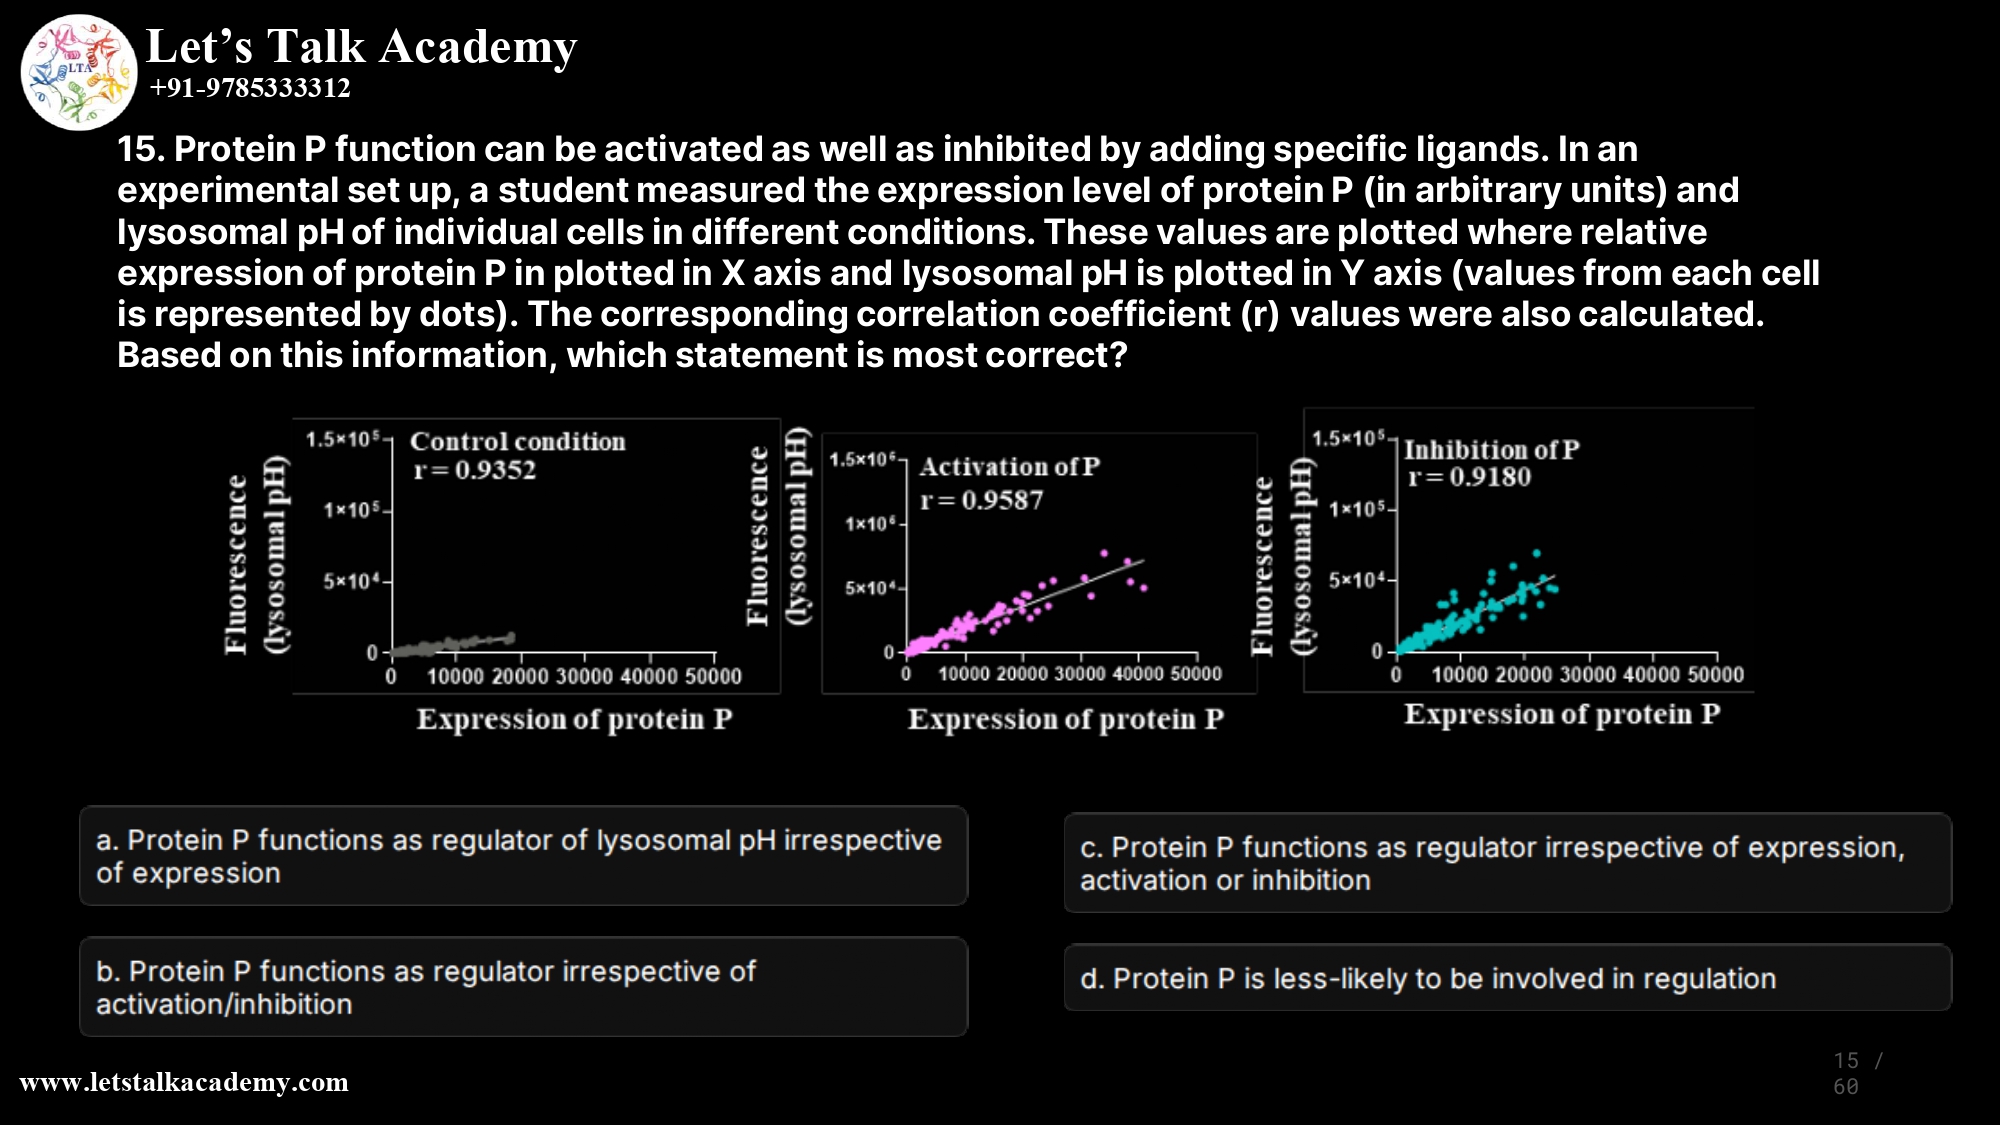
15. Protein P function can be activated as well as inhibited by adding specific ligands. In an experimental
set up, a student measured the expression level of protein P (in arbitrary units) and lysosomal pH of
individual cells in different conditions. These values are plotted where relative expression of protein P
in plotted in X axis and lysosomal pH is plotted in Y axis (values from each cell is represented by dots).
The corresponding correlation coefficient (r) values were also calculated. Based on this information,
which statement is most correct?
a) Protein P may function as a regulator of lysosomal pH irrespective of its expression
a) Protein P may function as a regulator of lysosomal pH irrespective of its activation or
inhibition
c) Protein P may function as a regulator of lysosomal pH irrespective of its expression,
activation or inhibition
d) Protein P is less-likely to be involved in the regulation of lysosomal pH in any conditions.
Protein P most likely functions as a regulator of lysosomal pH irrespective of its expression level, activation, or inhibition state, so option c is the most correct. The very high positive correlation between protein P expression and lysosomal pH in all three conditions supports a consistent regulatory role.
Understanding the graphs and r values
In all three scatter plots, the X‑axis shows relative expression of protein P, and the Y‑axis shows lysosomal pH readout as fluorescence.
The correlation coefficient r is a measure of the strength and direction of a linear relationship between two quantitative variables; values close to +1 indicate a very strong positive linear relationship, where higher values of one variable are associated with higher values of the other.
Here, the r values are:
-
Control: r=0.9352 (strong positive correlation)
-
Activation of P: r=0.9587 (strong positive correlation)
-
Inhibition of P: r=0.9180 (strong positive correlation)
The fact that r remains high and positive in control, activation, and inhibition conditions shows that, irrespective of ligand state, higher expression of P is consistently associated with higher lysosomal pH (or higher fluorescence corresponding to pH).
Option‑wise explanation
Option a
Statement: Protein P functions as regulator of lysosomal pH irrespective of expression.
-
The graphs clearly show that changes in expression of P are tightly linked with changes in lysosomal pH (high r in all panels).
-
Saying “irrespective of expression” would mean pH regulation does not depend on expression level, which contradicts the strong positive correlations between expression and pH. Therefore, option a is incorrect.
Option b
Statement: Protein P functions as regulator irrespective of activation/inhibition.
-
This option acknowledges regulation but ignores the role of expression level, even though expression is the X‑axis variable whose variation shows strong correlation with pH.
-
Moreover, the slopes and scatter patterns may differ slightly between activation and inhibition conditions, suggesting that ligands can modulate how strongly P affects pH, even if the relationship stays positive. So, saying “irrespective of activation/inhibition” is too strong and incomplete, making b not the best answer.
Option c
Statement: Protein P functions as regulator irrespective of expression, activation, or inhibition.
-
Interpreting the intent of this statement in the exam context: it emphasizes that in every tested condition (control, activation, inhibition) protein P expression remains strongly and positively correlated with lysosomal pH, indicating a robust regulatory role of P over lysosomal pH across states.
-
Since r is high and positive in all three conditions, the most defensible conclusion from the data is that P is consistently involved in regulating lysosomal pH, and this conclusion holds whether P is ligand‑activated or ligand‑inhibited; this is what the exam setter is capturing with option c, so c is the most correct answer.
Option d
Statement: Protein P is less likely to be involved in regulation.
-
A weak or zero correlation (r near 0) would suggest little or no relationship between P expression and pH, making regulation unlikely.
-
Here, r is above 0.9 in all conditions, which is evidence of a strong relationship, strongly supporting—not refuting—a regulatory role. Thus, d is clearly incorrect.
SEO‑optimized introduction
In many cell biology questions, students must interpret scatter plots and correlation coefficients to infer whether a protein truly regulates a cellular parameter such as lysosomal pH. In this problem, the expression of protein P is plotted against lysosomal pH under control, activation, and inhibition conditions, each yielding a very high positive correlation. Correctly reading these correlation graphs reveals that protein P consistently functions as a regulator of lysosomal pH, making option c the most accurate interpretation.


