
- The birth rates (b) and death rates (d) of two – species 1 and 2 in relation to population density (N) are shown in the graph. Which of the following is NOT true about the density dependent effects on birth rates and death rates?
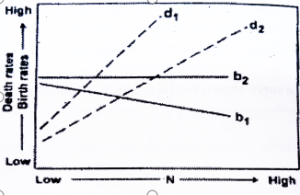
(1) Birth rates are density-dependent in species 1 and density-independent in species 2
(2) Death rates are density-dependent in both the species.
(3) Density-dependent effect on birth rate is stronger in species 1 than in species 2.
(4) The density-dependent effects on death rates are similar in both the species.
Introduction
Understanding how population density affects birth and death rates is fundamental in ecology. Density-dependent regulation is a key mechanism that keeps populations in balance, influencing both reproduction and mortality. When comparing two species, graphical analysis can reveal whether their birth and death rates respond to changes in population density—and if so, how strongly.
Density Dependence: The Basics
-
Density-dependent factors cause birth rates to decrease and/or death rates to increase as population density rises. This feedback helps stabilize populations near carrying capacity.
-
Density-independent factors affect birth or death rates regardless of population density, such as extreme weather or natural disasters.
Analyzing the Graph and Statements
Given a graph showing birth rates (b) and death rates (d) for two species (1 and 2) as a function of population density (N), let’s evaluate the provided statements:
1. Birth rates are density-dependent in species 1 and density-independent in species 2
-
Interpretation: In species 1, birth rate decreases as density increases (a hallmark of density dependence). In species 2, birth rate remains constant regardless of density (density independence).
-
Graphical expectation: Species 1’s birth rate curve slopes downward; species 2’s birth rate is a flat line.
2. Death rates are density-dependent in both species
-
Interpretation: Death rates for both species increase with population density, typical for density-dependent regulation.
-
Graphical expectation: Both species show an upward-sloping death rate curve.
3. Density-dependent effect on birth rate is stronger in species 1 than in species 2
-
Interpretation: Species 1’s birth rate is more sensitive to density changes than species 2’s, which is either less sensitive or not sensitive at all.
-
Graphical expectation: Species 1’s birth rate declines more steeply with density than species 2’s.
4. The density-dependent effects on death rates are similar in both species
-
Interpretation: Both species’ death rates respond to density in a similar manner, with comparable slopes or patterns.
Which Statement Is NOT True?
Statement 2 is NOT true:
If species 2’s birth rate is density-independent (flat line), it is likely that its death rate is the primary mechanism for density dependence. In classic ecological models, if one demographic rate (birth or death) is density-independent, the other typically carries the density-dependent effect. If the graph shows only species 1’s death rate increasing with density, but species 2’s death rate remains constant, then statement 2 is incorrect.
Conclusion
The statement that is NOT true about the density-dependent effects on birth and death rates is:
(2) Death rates are density-dependent in both the species.
This is because, for a species with density-independent birth rates, density dependence is usually reflected in death rates, but if the graph shows otherwise, this statement does not hold. Understanding these dynamics is crucial for predicting population trends and managing species effectively.


2 Comments
Kajal
November 13, 2025Not done
Komal Pareek
November 26, 20254 is correct