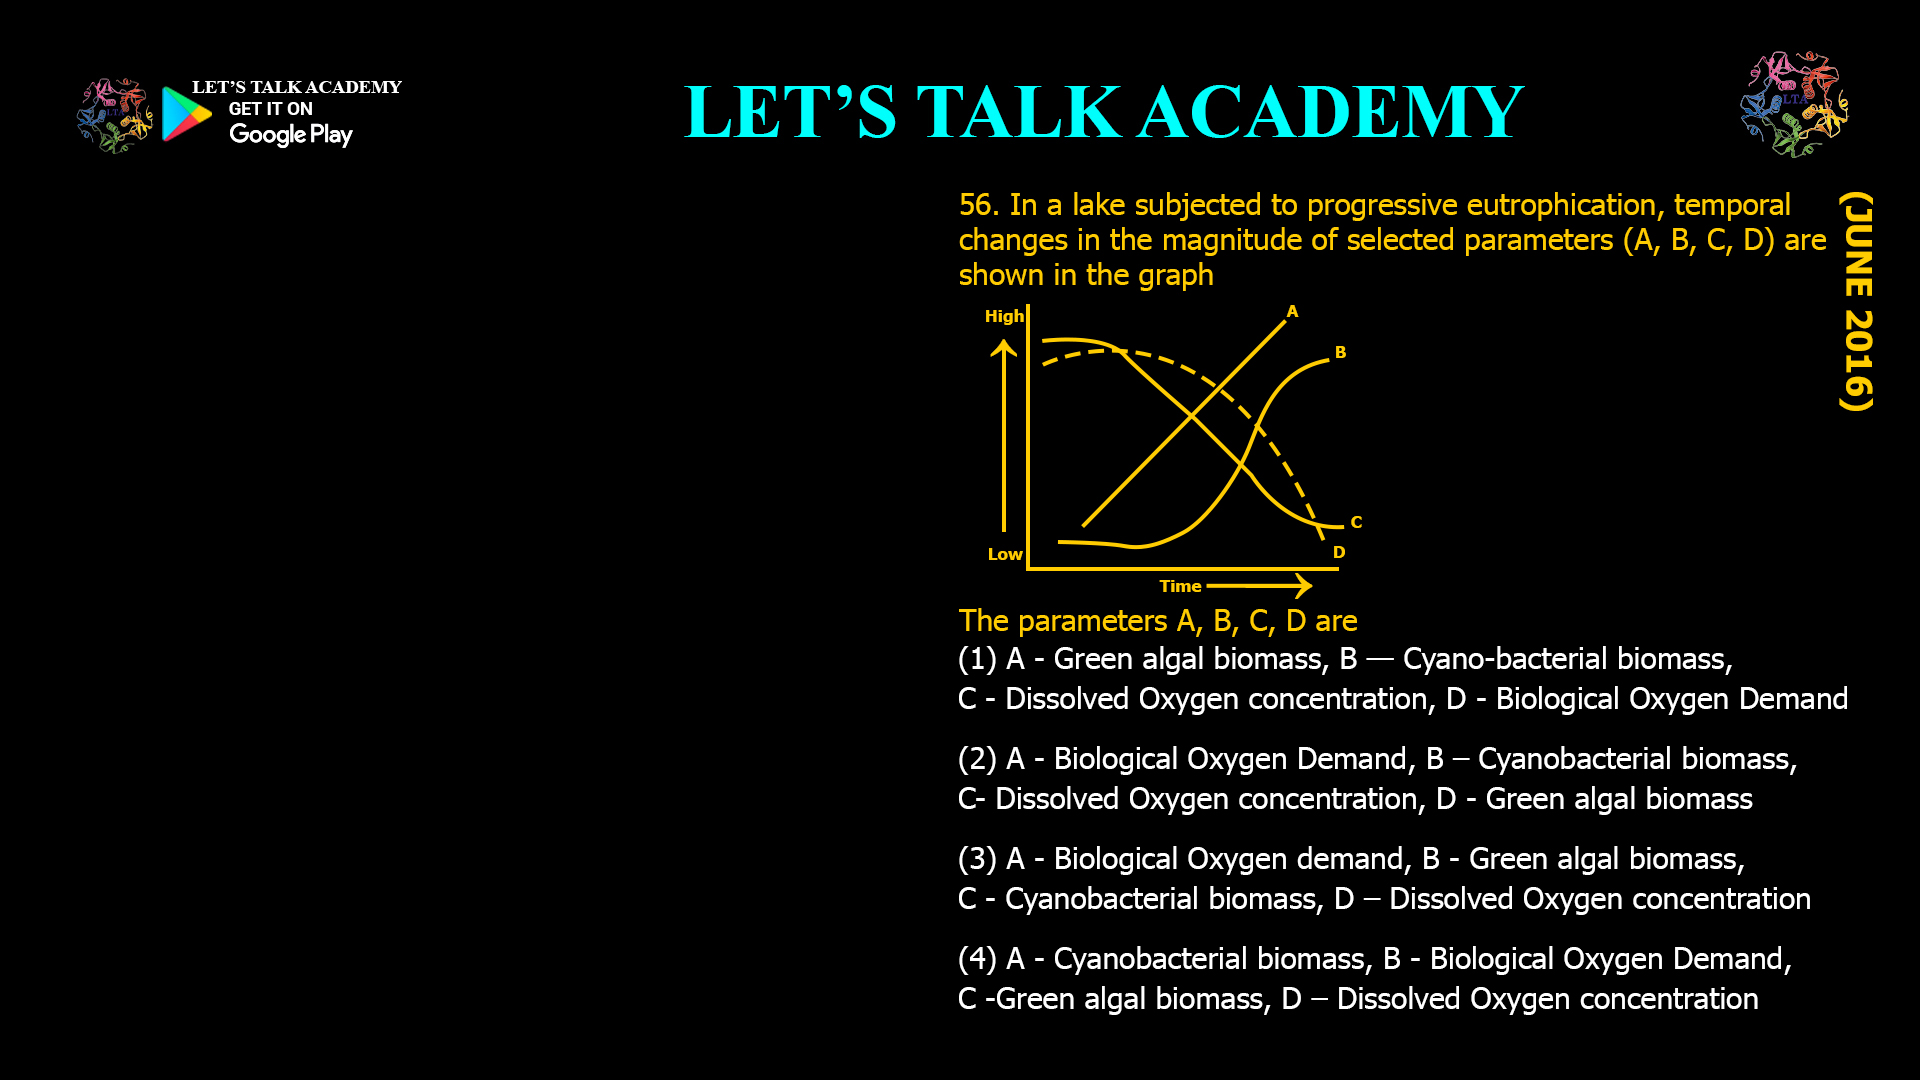
- In a lake subjected to progressive eutrophication,temporal changes in the magnitude of selectedparameters (A, B, C, D) are shown in the graph
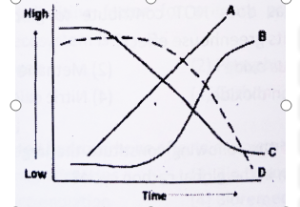
The parameters A, B, C, D are
(1) A – Green algal biomass, B — Cyano-bacterial biomass, C – Dissolved Oxygen concentration, D – Biological Oxygen Demand
(2) A – Biological Oxygen Demand, B – Cyanobacterial biomass, C- Dissolved Oxygen
concentration, D – Green algal biomass
(3) A – Biological Oxygen demand, B – Green algal biomass, C – Cyanobacterial biomass, D – Dissolved Oxygen concentration
(4) A – Cyanobacterial biomass, B – Biological Oxygen Demand, C -Green algal biomass, D – Dissolved Oxygen concentration
What is Progressive Eutrophication?
Eutrophication is the process by which a water body becomes enriched with nutrients, primarily nitrogen and phosphorus, leading to increased primary productivity and the proliferation of algae and aquatic plants. While eutrophication can occur naturally over long time scales, human activities such as agriculture, urbanization, and wastewater discharge have greatly accelerated the process in many lakes and rivers.
As eutrophication progresses, the following stages are commonly observed:
-
Nutrient Enrichment: Nutrients accumulate in the water, stimulating the growth of algae and phytoplankton.
-
Algal Blooms: Green algae and cyanobacteria (blue-green algae) rapidly increase in biomass.
-
Increased BOD: As algae and other plants die, their decomposition by bacteria increases the biological oxygen demand.
-
Oxygen Depletion: The decomposition of organic matter consumes dissolved oxygen, leading to hypoxic or anoxic conditions.
-
Ecosystem Decline: Reduced oxygen levels can cause fish kills, loss of biodiversity, and changes in species composition.
Key Parameters Affected by Eutrophication
The main parameters that change during progressive eutrophication are:
-
Green Algal Biomass: Increases rapidly as nutrients become available, often peaking early in the eutrophication process.
-
Cyanobacterial Biomass: Cyanobacteria (blue-green algae) may increase later, especially when conditions favor their growth (e.g., high temperatures, low nitrogen-to-phosphorus ratios).
-
Dissolved Oxygen (DO): Initially, DO may be high due to photosynthesis by algae, but as algal blooms die and decompose, DO levels drop sharply.
-
Biological Oxygen Demand (BOD): Increases as more organic matter accumulates and decomposes in the water.
Temporal Trends in a Eutrophying Lake
When plotting the temporal changes of these parameters during progressive eutrophication, the following patterns typically emerge:
-
Early Stage:
-
Green algal biomass rises quickly.
-
Cyanobacterial biomass may begin to increase but remains lower than green algae.
-
DO may initially increase due to photosynthesis but soon starts to decline as algal blooms die.
-
BOD increases as more organic matter accumulates and decomposes.
-
-
Mid to Late Stage:
-
Green algal biomass may stabilize or decline as nutrients are depleted or as cyanobacteria outcompete green algae.
-
Cyanobacterial biomass may surge, especially if conditions favor their growth.
-
DO continues to drop as decomposition consumes oxygen.
-
BOD remains high or increases further as more organic matter is produced and decomposed.
-
Interpreting the Graph: Matching Parameters to Labels
Given a graph showing temporal changes in parameters A, B, C, and D during progressive eutrophication, the correct assignment of labels is based on the typical trends described above.
Let’s review the options:
-
(1) A – Green algal biomass, B — Cyanobacterial biomass, C – Dissolved Oxygen concentration, D – Biological Oxygen Demand
-
Early Rise: Green algal biomass (A) rises first.
-
Later Rise: Cyanobacterial biomass (B) may increase later.
-
DO (C): Initially stable or increasing, then declines as decomposition increases.
-
BOD (D): Increases steadily as organic matter accumulates and decomposes.
-
-
(2) A – Biological Oxygen Demand, B – Cyanobacterial biomass, C- Dissolved Oxygen concentration, D – Green algal biomass
-
BOD (A): Should increase, not necessarily first.
-
Cyanobacterial biomass (B): May rise later, but not typically before green algae.
-
DO (C): Declines, but green algal biomass (D) should rise first, not last.
-
This option does not match the typical sequence.
-
-
(3) A – Biological Oxygen demand, B – Green algal biomass, C – Cyanobacterial biomass, D – Dissolved Oxygen concentration
-
BOD (A): Should not rise before algal biomass.
-
Green algal biomass (B): Should rise first.
-
Cyanobacterial biomass (C): May rise later.
-
DO (D): Declines as decomposition increases.
-
This option does not match the typical sequence.
-
-
(4) A – Cyanobacterial biomass, B – Biological Oxygen Demand, C -Green algal biomass, D – Dissolved Oxygen concentration
-
Cyanobacterial biomass (A): Should not be the first to rise.
-
BOD (B): Should not rise before algal biomass.
-
Green algal biomass (C): Should rise first, not after BOD.
-
DO (D): Declines as decomposition increases.
-
This option does not match the typical sequence.
-
The most accurate assignment is option (1):
A – Green algal biomass, B — Cyanobacterial biomass, C – Dissolved Oxygen concentration, D – Biological Oxygen Demand
This matches the typical sequence of changes during progressive eutrophication: green algae rise first, cyanobacteria may increase later, DO declines as decomposition increases, and BOD rises as organic matter accumulates.
Why This Matters
Understanding the temporal changes in these parameters is crucial for:
-
Monitoring Water Quality: Detecting early signs of eutrophication allows for timely intervention.
-
Managing Nutrient Inputs: Reducing nitrogen and phosphorus inputs can slow or reverse eutrophication.
-
Protecting Aquatic Life: Maintaining adequate dissolved oxygen levels is essential for fish and other aquatic organisms.
-
Informing Policy: Data on eutrophication trends guide environmental regulations and restoration efforts.
Key Takeaways
-
Progressive eutrophication is driven by nutrient enrichment, leading to algal blooms, increased BOD, and reduced DO.
-
Green algal biomass typically rises first, followed by cyanobacterial biomass in favorable conditions.
-
Dissolved oxygen declines as algal blooms die and decompose, while BOD increases.
-
The correct assignment of parameters is:
-
A – Green algal biomass
-
B – Cyanobacterial biomass
-
C – Dissolved Oxygen concentration
-
D – Biological Oxygen Demand
-
Summary Table
| Parameter | Typical Trend During Eutrophication |
|---|---|
| Green algal biomass | Rises first, peaks early |
| Cyanobacterial biomass | May rise later, especially if conditions favor |
| Dissolved Oxygen (DO) | Initially stable or high, then declines |
| Biological Oxygen Demand | Increases steadily as decomposition proceeds |
Conclusion
In a lake subjected to progressive eutrophication, the temporal changes in key parameters follow a predictable sequence: green algal biomass rises first, cyanobacterial biomass may increase later, dissolved oxygen declines as decomposition increases, and biological oxygen demand rises. The most accurate assignment of these parameters is:
(1) A – Green algal biomass, B — Cyanobacterial biomass, C – Dissolved Oxygen concentration, D – Biological Oxygen Demand


3 Comments
Kirti Agarwal
November 7, 2025Opt 1
Kajal
November 15, 2025Option 1 is correct
Sakshi Kanwar
November 28, 2025A – Green algal biomass, B – Cyano-bacterial biomass, C – Dissolved Oxygen concentration, D- Biological Oxygen Demand