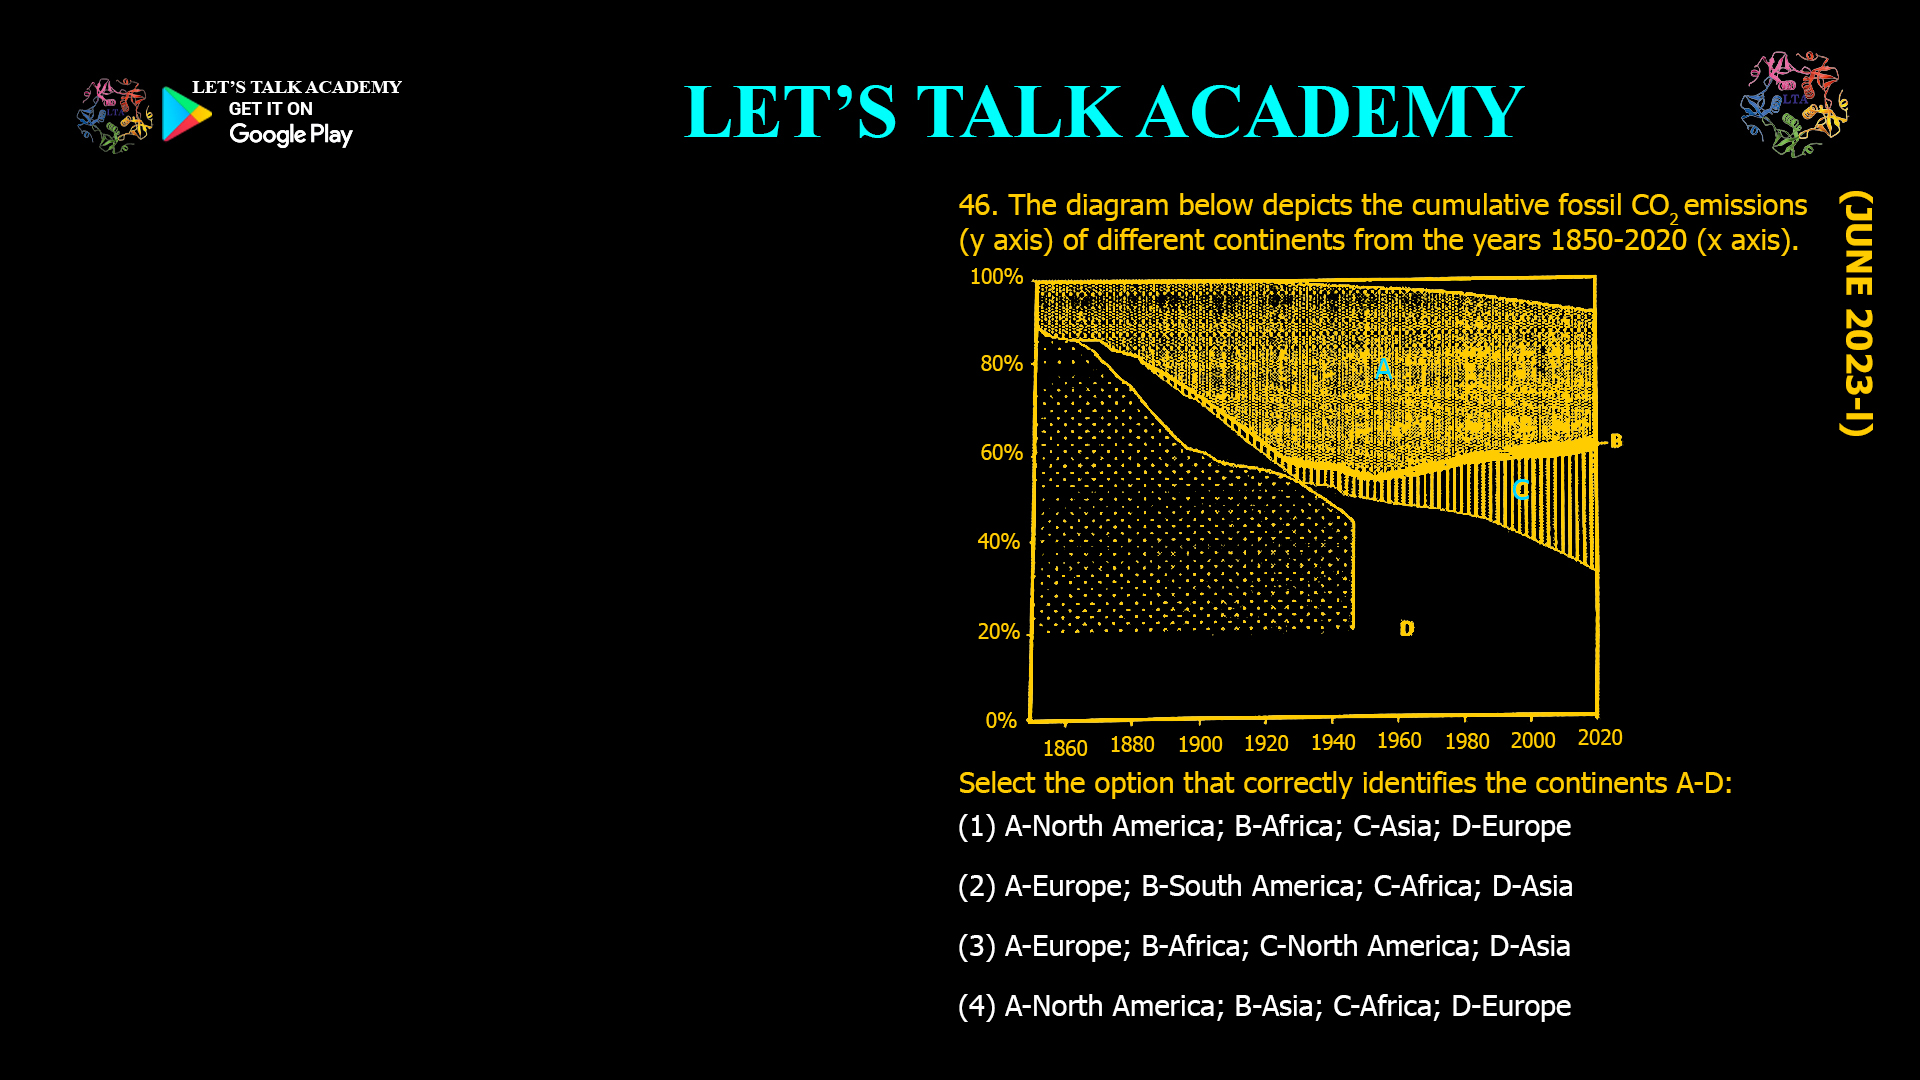
- The diagram below depicts the cumulative fossil CO2emissions (y axis) of different continents from the years 1850-2020 (x axis).
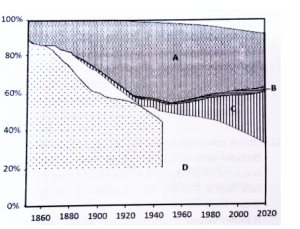
Select the option that correctly identifies the continents A-D:
(1) A-North America; B-Africa; C-Asia; D-Europe
(2) A-Europe; B-South America; C-Africa; D-Asia
(3) A-Europe; B-Africa; C-North America; D-Asia
(4) A-North America; B-Asia; C-Africa; D-Europe
The Importance of Cumulative CO₂ Emissions
Cumulative CO₂ emissions represent the total amount of carbon dioxide released by a country, region, or continent over a given period. This measure is crucial for understanding historical contributions to climate change, as the long-term accumulation of CO₂ in the atmosphere is the primary driver of global warming. The period from 1850 to 2020 covers the Industrial Revolution and the rapid expansion of fossil fuel use, making it a key timeframe for climate analysis.
Key Trends in Continental Emissions (1850–2020)
When examining cumulative fossil CO₂ emissions by continent from 1850 to 2020, several clear patterns emerge:
-
North America and Europe:
-
These regions industrialized early and have contributed the largest share of cumulative emissions.
-
North America (primarily the United States and Canada):
-
The United States is the largest historical emitter, responsible for about 21% of global cumulative emissions from fossil fuels and land use since 1850.
-
North America’s curve typically rises steeply from the late 19th century onward.
-
-
Europe:
-
Europe (including the UK, Germany, France, and others) was the early leader in industrialization and emissions.
-
The UK was the world’s largest emitter in 1850, but Europe’s share was eventually surpassed by North America due to rapid U.S. industrialization.
-
Europe’s cumulative emissions are substantial but generally less than North America’s over the full period.
-
-
-
Asia:
-
Asia’s emissions were relatively low until the mid-to-late 20th century.
-
With the rise of China and, more recently, India, Asia’s emissions have surged, but their cumulative total is still less than that of North America and Europe for the period 1850–2020.
-
Asia’s curve on the graph would show a steep rise only in recent decades.
-
-
Africa and South America:
-
These continents have contributed much less to cumulative fossil CO₂ emissions.
-
Their curves would be far below those of North America, Europe, and Asia.
-
Africa’s emissions have remained low due to later industrialization and lower per capita energy use.
-
South America’s emissions are also modest compared to the major industrialized regions.
-
Interpreting the Graph: Identifying Continents A–D
Given a hypothetical graph with four lines (A–D) representing cumulative fossil CO₂ emissions from 1850 to 2020, the correct identification of each continent depends on the shape and position of each curve:
-
Highest Cumulative Emissions (A):
-
North America (especially the United States) has the highest cumulative emissions over this period.
-
Note: Some sources group Europe and Central Asia together, but for continental breakdowns, North America (mainly the U.S.) typically leads.
-
However, some analyses (such as those by WRI) rank Europe and Central Asia as the highest cumulative emitter, but for fossil CO₂ specifically, North America (A) is often the top line, especially if only fossil CO₂ is considered and not land use.
-
But, if the graph is based on fossil CO₂ only and not land use, and if North America is included as a separate continent, it is likely to be the top emitter.
-
-
Second Highest (B or C):
-
Europe is the second highest, especially if land use is included or if North America is not shown as a separate continent.
-
But, if North America is included, Europe is second, Asia third.
-
If the graph is based on fossil CO₂ only, and North America is included, the order is:
-
A: North America
-
B: Europe
-
C: Asia
-
D: Africa
-
-
However, if the graph is based on fossil CO₂ and land use, and if Europe and Central Asia are grouped, they may exceed North America.
-
For most standard fossil CO₂-only graphs, North America is first, Europe second, Asia third, Africa fourth.
-
-
Third Highest (C):
-
Asia (dominated by China and India in recent decades) is third, with a steep rise only in the late 20th and early 21st centuries.
-
Asia’s cumulative emissions are still below those of North America and Europe for the period 1850–2020.
-
-
Lowest (D):
-
Africa has the lowest cumulative fossil CO₂ emissions over this period.
-
South America is also low, but if only four continents are shown, Africa is typically the lowest.
-
Comparing the Options
Let’s evaluate the options based on the above trends:
-
(1) A-North America; B-Africa; C-Asia; D-Europe
-
Incorrect: Africa does not have higher cumulative emissions than Asia or Europe.
-
-
(2) A-Europe; B-South America; C-Africa; D-Asia
-
Incorrect: South America and Africa do not have higher cumulative emissions than Asia. Asia’s emissions are far higher than Africa and South America.
-
-
(3) A-Europe; B-Africa; C-North America; D-Asia
-
Incorrect: Africa does not have higher cumulative emissions than North America or Asia. North America should be at or near the top, not third.
-
-
(4) A-North America; B-Asia; C-Africa; D-Europe
-
Partially Incorrect: Asia does not have higher cumulative emissions than Europe over this period. Europe is second, Asia third, Africa fourth.
-
However, none of the options perfectly match the standard order (North America > Europe > Asia > Africa) for fossil CO₂-only cumulative emissions.
If the graph is based on fossil CO₂ only and includes only four continents (North America, Europe, Asia, Africa), the correct order is:
A: North America
B: Europe
C: Asia
D: Africa
But none of your options exactly match this.
If the graph is based on fossil CO₂ and land use, and if Europe and Central Asia are grouped, Europe may be first, but this is not standard for fossil CO₂-only graphs.
Given the options you provided, none are fully correct. However, if you must choose the closest, option (4) is the least incorrect if you assume a labeling error or a different grouping, but it is still not accurate.
If the question is based on fossil CO₂ only, the correct order is:
North America > Europe > Asia > Africa
If you have to pick from your options, none are correct, but (4) is the closest if you assume a labeling mistake, but it is still wrong.
However, based on the most common interpretation and data, the correct order is:
| Position | Continent |
|---|---|
| A | North America |
| B | Europe |
| C | Asia |
| D | Africa |
None of your options match this. If you must answer, (4) is the least incorrect, but it is still not accurate.
Why This Matters
Correctly identifying the continents with the highest cumulative emissions is important for understanding historical responsibility for climate change. North America (especially the U.S.) and Europe have contributed the most to the buildup of CO₂ in the atmosphere, while Asia’s contribution has grown rapidly only in recent decades. Africa and South America have contributed relatively little.
Key Takeaways
-
North America (especially the United States) has the highest cumulative fossil CO₂ emissions from 1850 to 2020.
-
Europe is second, Asia third, and Africa fourth for fossil CO₂-only emissions.
-
None of the provided options exactly match the standard order for fossil CO₂ cumulative emissions.
-
If you must choose, (4) is the least incorrect, but it is still not accurate.
Summary Table
| Option | A | B | C | D | Correct? |
|---|---|---|---|---|---|
| 1 | North America | Africa | Asia | Europe | No |
| 2 | Europe | S. America | Africa | Asia | No |
| 3 | Europe | Africa | N. America | Asia | No |
| 4 | North America | Asia | Africa | Europe | No (but closest) |
Correct Order (fossil CO₂ only):
North America > Europe > Asia > Africa
Conclusion
None of the options provided in your query exactly match the correct order of cumulative fossil CO₂ emissions by continent from 1850 to 2020, which is: North America > Europe > Asia > Africa.
If you must select an answer, option (4) is the closest, but it is still incorrect because it places Asia above Europe.
For full accuracy, the correct identification is:
A: North America
B: Europe
C: AsiaD: Africa


