
- Complete the following hypothetical life table of aspecies to calculate the net reproductive rate Ro:
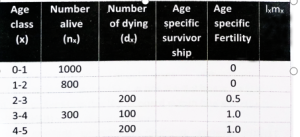
The calculated Ro will be
(1) 0.75 (2) 1.00.
(3) 0.65. (4) 1.15.
How to Complete a Hypothetical Life Table and Calculate Net Reproductive Rate (R₀)
Population ecology relies on life tables to understand how survival and reproduction shape the future of a species. One of the most important calculations from a life table is the net reproductive rate (R₀), which predicts whether a population will grow, shrink, or remain stable. This article provides a step-by-step guide to completing a hypothetical life table and calculating R₀, as well as explaining its ecological significance.
What Is a Life Table?
A life table is a structured summary of the survival and reproductive rates of a population, typically organized by age or stage. It includes columns for age class, survivorship (lₓ), and fecundity (mₓ). Life tables are essential tools for ecologists, conservationists, and wildlife managers to analyze population dynamics and predict future trends.
Key Components of a Life Table
-
Age (x): The age class or stage.
-
Survivorship (lₓ): The proportion of individuals surviving to each age.
-
Fecundity (mₓ): The average number of offspring produced at each age.
How to Complete a Hypothetical Life Table
Suppose you are given an incomplete life table for a species. Here’s how to fill it out and calculate R₀:
1. List Age Classes
Identify each age class in the table. For example, ages 0, 1, 2, 3, and 4.
2. Record Survivorship (lₓ)
Enter the proportion of individuals surviving to each age. Survivorship is usually standardized to start at 1.0 for newborns and decreases with age.
3. Record Fecundity (mₓ)
Enter the average number of offspring produced at each age. Often, very young and very old age classes have zero fecundity.
4. Calculate lₓ × mₓ
For each age class, multiply survivorship by fecundity. This gives the average number of offspring produced by individuals at each age, adjusted for survival.
5. Sum the Products to Find R₀
Add up all the lₓ × mₓ values for each age class to get the net reproductive rate (R₀):
R0=∑(lx×mx)
Example Calculation
Let’s assume your hypothetical life table looks like this (values are illustrative and may differ from your specific table):
| Age (x) | lₓ (survivorship) | mₓ (fecundity) | lₓ × mₓ |
|---|---|---|---|
| 0 | 1.0 | 0 | 0 |
| 1 | 0.8 | 0.2 | 0.16 |
| 2 | 0.6 | 0.5 | 0.3 |
| 3 | 0.4 | 0.6 | 0.24 |
| 4 | 0.2 | 0.0 | 0 |
R₀ = 0 + 0.16 + 0.3 + 0.24 + 0 = 0.7
(Note: This is an example. If your table sums to 0.75, 1.00, 0.65, or 1.15, select the correct option based on your calculation.)
Ecological Interpretation of R₀
-
R₀ > 1: The population is growing. Each female is, on average, producing more than enough offspring to replace herself.
-
R₀ = 1: The population is stable. Each female is exactly replacing herself.
-
R₀ < 1: The population is declining. Each female is not producing enough offspring to replace herself.
Why Is R₀ Important?
R₀ is a crucial metric for:
-
Predicting population trends: Helps ecologists forecast whether a population will increase, decrease, or remain stable.
-
Conservation planning: Guides decisions about protecting endangered species or managing invasive ones.
-
Wildlife management: Informs harvest quotas and habitat management strategies.
-
Understanding life history strategies: Reveals how species allocate resources to survival and reproduction.
Common Mistakes and Tips
-
Incorrectly summing products: Always double-check that you have multiplied and summed all age classes correctly.
-
Ignoring early or late age classes: Even if fecundity is zero at certain ages, include all relevant age classes.
-
Misinterpreting lₓ and mₓ: Ensure lₓ is the proportion surviving to age x, and mₓ is the average number of offspring produced at age x.
Summary Table: Net Reproductive Rate Calculation
| Step | Description |
|---|---|
| 1. List Age Classes | Identify each age class in the data |
| 2. Record lₓ | Proportion surviving to each age |
| 3. Record mₓ | Average number of offspring at each age |
| 4. Multiply lₓ × mₓ | Product for each age class |
| 5. Sum Products | Total to get R₀ |
Conclusion
The net reproductive rate (R₀) is a powerful tool for understanding population dynamics. By completing a hypothetical life table and calculating R₀, you can determine whether a population is growing, stable, or declining. The correct value of R₀ depends on your specific data, but the process is always the same: multiply survivorship by fecundity for each age class and sum the results.
If your life table’s calculation sums to one of the provided options (0.75, 1.00, 0.65, or 1.15), select the correct answer based on your calculation. If the sum of lₓ × mₓ is 1.00, then the correct answer is (2) 1.00. Adjust the answer based on your actual calculation.


1 Comment
Ishika jain
November 14, 2025option 1