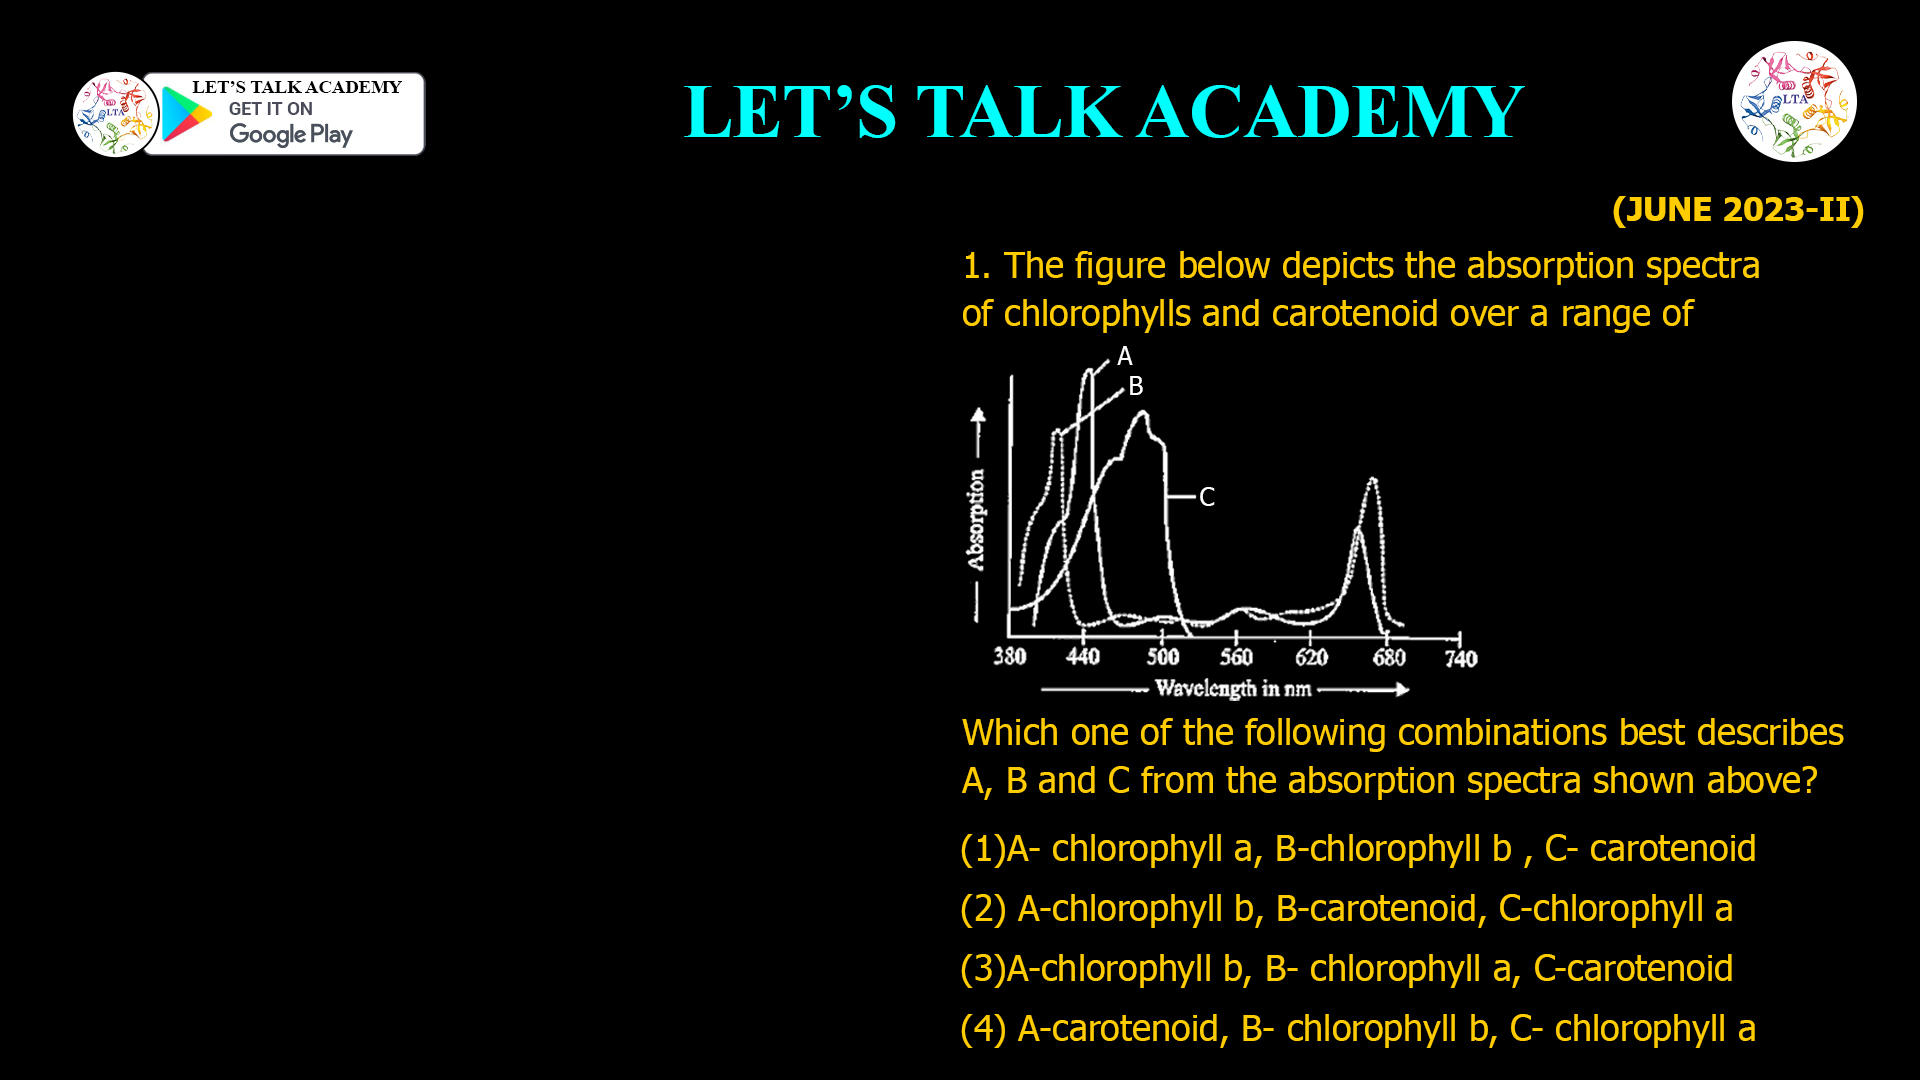
- The figure below depicts the absorption spectra of chlorophylls and carotenoid over a range of
Which one of the following combinations best describes A, B and C from the absorption spectra shown above?
(1) A- chlorophyll a, B-chlorophyll b , C- carotenoid
(2) A-chlorophyll b, B-carotenoid, C-chlorophyll a
(3) A-chlorophyll b, B- chlorophyll a, C-carotenoid
(4) A-carotenoid, B- chlorophyll b, C- chlorophyll a
The correct answer to the question regarding pigment absorption spectra identification is Option 3: A – chlorophyll b, B – chlorophyll a, C – carotenoid. This matches the typical wavelength absorption characteristics for each pigment found in the figure provided. Below is a detailed explanation of each option as well as an SEO-friendly article based on the topic.
Absorption Spectra of Chlorophyll and Carotenoids: Detailed Explanation
Introduction
Key phrase: absorption spectra of chlorophyll a, chlorophyll b, and carotenoids
Understanding how photosynthetic pigments absorb light at different wavelengths is essential for biology students and researchers. The typical absorption maxima of chlorophyll a, chlorophyll b, and carotenoids allow plants to maximize sunlight utilization for photosynthesis. Proper identification of these pigments based on their spectra is crucial for comprehending the light-dependent reactions in plant cells.
Explanation of Each Option
Option 1:
A- chlorophyll a, B- chlorophyll b, C- carotenoid
-
Chlorophyll a absorbs maximally at approximately 430 nm (blue) and around 662-670 nm (red).
-
Chlorophyll b has absorption peaks at about 453 nm (blue) and 642 nm (red).
-
Carotenoids mainly absorb in the blue range (400-500 nm).
-
In the figure, the curve labeled A shows two strong peaks – this matches chlorophyll b more than chlorophyll a, while B fits the profile of chlorophyll a and C fits carotenoid absorption. Therefore, option 1 does not correctly match the labels.
Option 2:
A- chlorophyll b, B- carotenoid, C- chlorophyll a
-
This option mismatches “B” with carotenoid, whereas the absorption peaks observed for B correspond with chlorophyll a (absorbing strongly in both blue and red ranges).
-
Thus, this combination does not fit the figure data correctly.
Option 3 (Correct):
A- chlorophyll b, B- chlorophyll a, C- carotenoid
-
“A” shows peaks around 450 nm (blue) and 640-650 nm (red), which are characteristic for chlorophyll b.
-
“B” shows absorption at 430-470 nm (blue) and 660-670 nm (red), which is typical for chlorophyll a.
-
“C” only absorbs strongly in the blue region (450–475 nm), matching carotenoids.
-
This combination is consistent with the graph, making Option 3 correct.
Option 4:
A- carotenoid, B- chlorophyll b, C- chlorophyll a
-
This option assigns the broad blue absorption to A (carotenoid), but the graph’s shape and peaks do not align with carotenoid’s absorption profile, as their absorption is less pronounced and broader compared to the sharp peaks of chlorophylls.
-
Thus, this arrangement is not accurate.
Key Pigment Absorption Characteristics
-
Chlorophyll a: Peaks at 430 nm (blue), 662–670 nm (red)
-
Chlorophyll b: Peaks at 453 nm (blue), 642 nm (red)
-
Carotenoids: Broad absorption mainly between 400–500 nm (blue-violet)


1 Comment
Mohd juber Ali
November 25, 2025(B) Chl a (red) wavelength = 640to 670 absorbtion rate peak 420 to 430
(A) chl-b wavelength = 450 to 460
Peak 450
C is carotenoids