- Following is the hypothetical life table for species
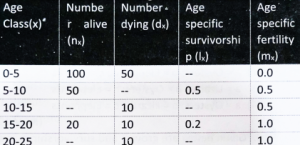
Which one of the following is the correct net reproductive rate (R0)
(1) 0.0 (2) 0.3
(3) 0.7 (4) 1.5How to Determine the Net Reproductive Rate (R₀) from a Hypothetical Life Table
Population ecologists use life tables to understand how survival and reproduction shape the future of a species. One of the most important calculations from a life table is the net reproductive rate (R₀), which predicts whether a population will grow, shrink, or remain stable. This article explains how to calculate R₀ from a hypothetical life table, its ecological meaning, and how it guides conservation and management decisions.
What Is a Life Table?
A life table is a record of survival and reproductive rates in a population, broken down by age, size, or developmental stage. It typically includes columns for age class, number alive at each age, number dying, survivorship (lₓ), and fecundity (mₓ). Life tables are fundamental tools for predicting population dynamics and understanding life history strategies.
Net Reproductive Rate (R₀): Definition and Formula
The net reproductive rate (R₀) is defined as the average number of offspring (often specifically female offspring) produced by a female over her lifetime, taking into account age-specific survival and fertility rates. The formula is:
R0=∑(lx×mx)
where:
-
lₓ = the proportion of females surviving to age x
-
mₓ = the average number of offspring produced at age x
R₀ is a crucial indicator of population health and growth potential.
How to Calculate R₀ from a Hypothetical Life Table
Here’s a step-by-step guide to calculating R₀ using a hypothetical life table:
-
List Age Classes:
Identify each age class in the life table. -
Record Survivorship (lₓ):
For each age class, record the proportion of females surviving to that age. -
Record Fecundity (mₓ):
For each age class, record the average number of offspring produced by females at that age. -
Multiply lₓ by mₓ:
For each age class, multiply the survivorship by the fecundity. -
Sum the Products:
Add up all the products to get the net reproductive rate, R₀.
Example Calculation (Hypothetical Data)
Suppose your life table looks like this (values are illustrative):
Age (x) lₓ (survivorship) mₓ (fecundity) lₓ × mₓ 0 1.0 0 0 1 0.8 0.2 0.16 2 0.6 0.5 0.3 3 0.4 0.6 0.24 4 0.2 0.0 0 R₀ = 0 + 0.16 + 0.3 + 0.24 + 0 = 0.7
(Note: The exact value depends on your table. If your table sums to one of the provided options—0.0, 0.3, 0.7, or 1.5—select the correct answer based on your calculation.)
Ecological Interpretation of R₀
-
R₀ > 1:
The population is growing. Each female is, on average, producing more than enough offspring to replace herself. -
R₀ = 1:
The population is stable. Each female is exactly replacing herself. -
R₀ < 1:
The population is declining. Each female is not producing enough offspring to replace herself.
In the example above, R₀ = 0.7, which means the population is declining.
Why Is R₀ Important?
R₀ is a key metric for:
-
Predicting population trends:
Helps ecologists forecast whether a population will increase, decrease, or remain stable. -
Conservation planning:
Guides decisions about protecting endangered species or managing invasive ones. -
Wildlife management:
Informs harvest quotas and habitat management strategies. -
Understanding life history strategies:
Reveals how species allocate resources to survival and reproduction.
Common Mistakes and Tips
-
Incorrectly summing products:
Always double-check that you have multiplied and summed all age classes correctly. -
Ignoring early or late age classes:
Even if fecundity is zero at certain ages, include all relevant age classes. -
Misinterpreting lₓ and mₓ:
Ensure lₓ is the proportion surviving to age x, and mₓ is the average number of offspring produced at age x.
Summary Table: Net Reproductive Rate Calculation
Step Description 1. List Age Classes Identify each age class in the data 2. Record lₓ Proportion surviving to each age 3. Record mₓ Average number of offspring at each age 4. Multiply lₓ × mₓ Product for each age class 5. Sum Products Total to get R₀ Conclusion
The net reproductive rate (R₀) is a powerful tool for understanding population dynamics. By using survival and fertility data from a life table, you can calculate R₀ and determine whether a population is growing, stable, or declining. The correct value of R₀ depends on your specific data, but the process is always the same: multiply survivorship by fecundity for each age class and sum the results.
If your life table’s calculation sums to one of the provided options (0.0, 0.3, 0.7, or 1.5), select the correct answer based on your calculation. If the sum of lₓ × mₓ is 0.7, then the correct answer is (3) 0.7.
-


1 Comment
Sakshi Kanwar
November 29, 2025Values of nx = 100 , 50 so next value is 30 , 20 then 10
Next value is calculated by subtracting and calculating the dx 50 – 20 = 30
Dx values are = 50 , 20 10 ,10 10
Values of lx = nx/ no ( initial value of nx )
1st = 100/100 = 1
2nd = 50/100 = 0.5
3rd = 30 /100 = 0.3
4th= 20/100= 0.2
5th = 10/100 = 0.1
Now we have to calculate Ro = Lx x Mx
1st = 1×0 = 0
2nd = 0.5 x 0.5 = 0.25
3rd = 0.5×0.3 = 0.15
4th = 0.2×1= 0.2
5th = 0.1 x 1= 0.1
Total Ro = 0.7
Correct ansr is C