- In a study of sexual isolation in a species of salamander, scientists brought together males and females from different populations and from the same population. They observed the
frequency of mating and calculated a sexual isolation index. One graph shows the relationship between mating frequency and genetic distance, and the other shows the relationship between sexual isolation index and geographic isolation.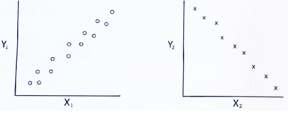
Choose the appropriate terms for of X1, Y1, X2 and Y2 in the figures, above.
(1) X1 = Geographic distance, Y1 = Sexual isolation index; X2 = Genetic distance, Y2 = mating frequency
(2) X1 = Geographic distance; Y1 = mating frequency; X2 = Genetic distance, Y2 = Sexual isolation index
(3) X1 = Genetic distance; Y1 = mating frequency; X2 = Sexual isolation index; Y2 = Geographic distance
(4) X1= Genetic distance; Y1 = Geographic distance; X2 = Sexual isolation index; Y2 = mating frequencyThe Study Design
Researchers bring together males and females from different and same salamander populations, record the frequency of mating, and calculate a sexual isolation index. They then plot relationships between:
-
Mating frequency and genetic distance
-
Sexual isolation index and geographic isolation
Deciphering the Graphs
To answer which terms correctly label the axes (X1, Y1, X2, Y2) in the figures:
-
Graph 1: Shows the relationship between mating frequency and genetic distance.
-
X1: Genetic distance (the independent variable, usually plotted on the X-axis)
-
Y1: Mating frequency (the dependent variable, plotted on the Y-axis)
-
-
Graph 2: Shows the relationship between sexual isolation index and geographic isolation.
-
X2: Geographic distance (the independent variable, on the X-axis)
-
Y2: Sexual isolation index (the dependent variable, on the Y-axis)
-
This matches the standard approach in evolutionary biology, where genetic or geographic distances are used as independent variables to examine their effects on mating behavior or reproductive isolation.
The Correct Option
Given the options:
-
X1 = Geographic distance, Y1 = Sexual isolation index; X2 = Genetic distance, Y2 = mating frequency
-
X1 = Geographic distance; Y1 = mating frequency; X2 = Genetic distance, Y2 = Sexual isolation index
-
X1 = Genetic distance; Y1 = mating frequency; X2 = Sexual isolation index; Y2 = Geographic distance
-
X1= Genetic distance; Y1 = Geographic distance; X2 = Sexual isolation index; Y2 = mating frequency
The correct answer is:
X1 = Genetic distance; Y1 = mating frequency; X2 = Geographic distance; Y2 = Sexual isolation index
This matches option (3).
Why This Is Correct
-
Studies on salamanders have shown that genetic distance is often plotted against mating frequency to assess how genetic divergence impacts reproductive compatibility.
-
Similarly, sexual isolation indices are plotted against geographic distance to explore how spatial separation influences the development of reproductive barriers.
Conclusion
When interpreting experimental data on sexual isolation in salamanders, Graph 1 should plot genetic distance (X1) against mating frequency (Y1), and Graph 2 should plot geographic distance (X2) against sexual isolation index (Y2). This approach allows scientists to uncover the relationships between genetic divergence, spatial separation, and the evolution of reproductive isolation.
Correct answer:
(3) X1 = Genetic distance; Y1 = mating frequency; X2 = Geographic distance; Y2 = Sexual isolation index -