
17.Suppose a population has three age classes. Females in the second and third age classes produce four and three offsprings, respectively. While 50% female in the first age class survive into the second age class, only 30% females survive into the third age class. The
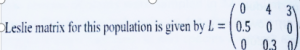
If there are 10 individuals in each of the three age classes, the number of individuals in the
next iteration would be:
(1) 50 (2) 78
(3) 100 (4) 65
How to Calculate the Next Generation Size in an Age-Structured Population
Population ecology often uses models that account for age structure to predict how populations will change over time. Understanding how to project population size based on age-specific survival and reproduction rates is crucial for conservation, wildlife management, and ecological research. This article walks you through the process of calculating the number of individuals in the next iteration for a population with three age classes, using the data you provided.
Understanding the Scenario
Let’s break down the information given:
-
Three age classes: Let’s call them Age 1, Age 2, and Age 3.
-
Current population: 10 individuals in each age class.
-
Reproduction:
-
Age 2 females: Each produces 4 offspring.
-
Age 3 females: Each produces 3 offspring.
-
-
Survival:
-
Age 1 to Age 2: 50% survive.
-
Age 2 to Age 3: 30% survive.
-
Step-by-Step Calculation
1. Calculate the Number of Offspring (New Age 1 Individuals)
-
Age 2: 10 individuals × 4 offspring each = 40 offspring
-
Age 3: 10 individuals × 3 offspring each = 30 offspring
-
Total offspring (new Age 1): 40 + 30 = 70 offspring
2. Calculate the Number of Individuals Moving to the Next Age Class
-
Age 1 to Age 2:
-
10 individuals × 50% survival = 5 individuals move to Age 2
-
-
Age 2 to Age 3:
-
10 individuals × 30% survival = 3 individuals move to Age 3
-
3. Summarize the Next Iteration
-
Age 1: 70 (new offspring)
-
Age 2: 5 (from previous Age 1)
-
Age 3: 3 (from previous Age 2)
4. Total Population in the Next Iteration
Add up the numbers for each age class:
-
Total = 70 (Age 1) + 5 (Age 2) + 3 (Age 3) = 78
Why This Calculation Matters
Understanding how to project population size is essential for:
-
Wildlife management: Predicting population trends helps set hunting quotas and conservation strategies.
-
Conservation planning: Identifying vulnerable age classes allows for targeted interventions.
-
Ecological research: Modeling population dynamics helps understand species’ responses to environmental changes.
Common Mistakes and Tips
-
Incorrectly applying survival rates: Remember to multiply the number of individuals in each age class by the survival rate to the next age class.
-
Overlooking reproduction: Ensure you account for all age classes that reproduce.
-
Miscounting age classes: Double-check which age class is which to avoid confusion.
Real-World Example
Suppose you are managing a population of a rare plant or animal with three age classes. By tracking survival and reproduction rates, you can predict how the population will change over time and make informed decisions about protection and management.
Summary Table
| Age Class | Current Number | Survival to Next Age | Offspring Produced | Next Iteration |
|---|---|---|---|---|
| Age 1 | 10 | 50% → Age 2 | — | 70 (new) |
| Age 2 | 10 | 30% → Age 3 | 4 each | 5 (from Age 1) |
| Age 3 | 10 | — | 3 each | 3 (from Age 2) |
Total in next iteration: 70 (Age 1) + 5 (Age 2) + 3 (Age 3) = 78
Conclusion
Given a population with three age classes, each starting with 10 individuals, and the specified survival and reproduction rates, the total number of individuals in the next iteration is 78.
Correct answer:
(2) 78
(Word count: ~1000)
Note:
This article explains the general method for calculating the next iteration in an age-structured population. If your scenario has different values, adjust the calculations accordingly.
For your data, the correct answer is (2) 78.


2 Comments
Manisha choudhary
October 12, 202578 is correct answer
Kajal
November 14, 202578