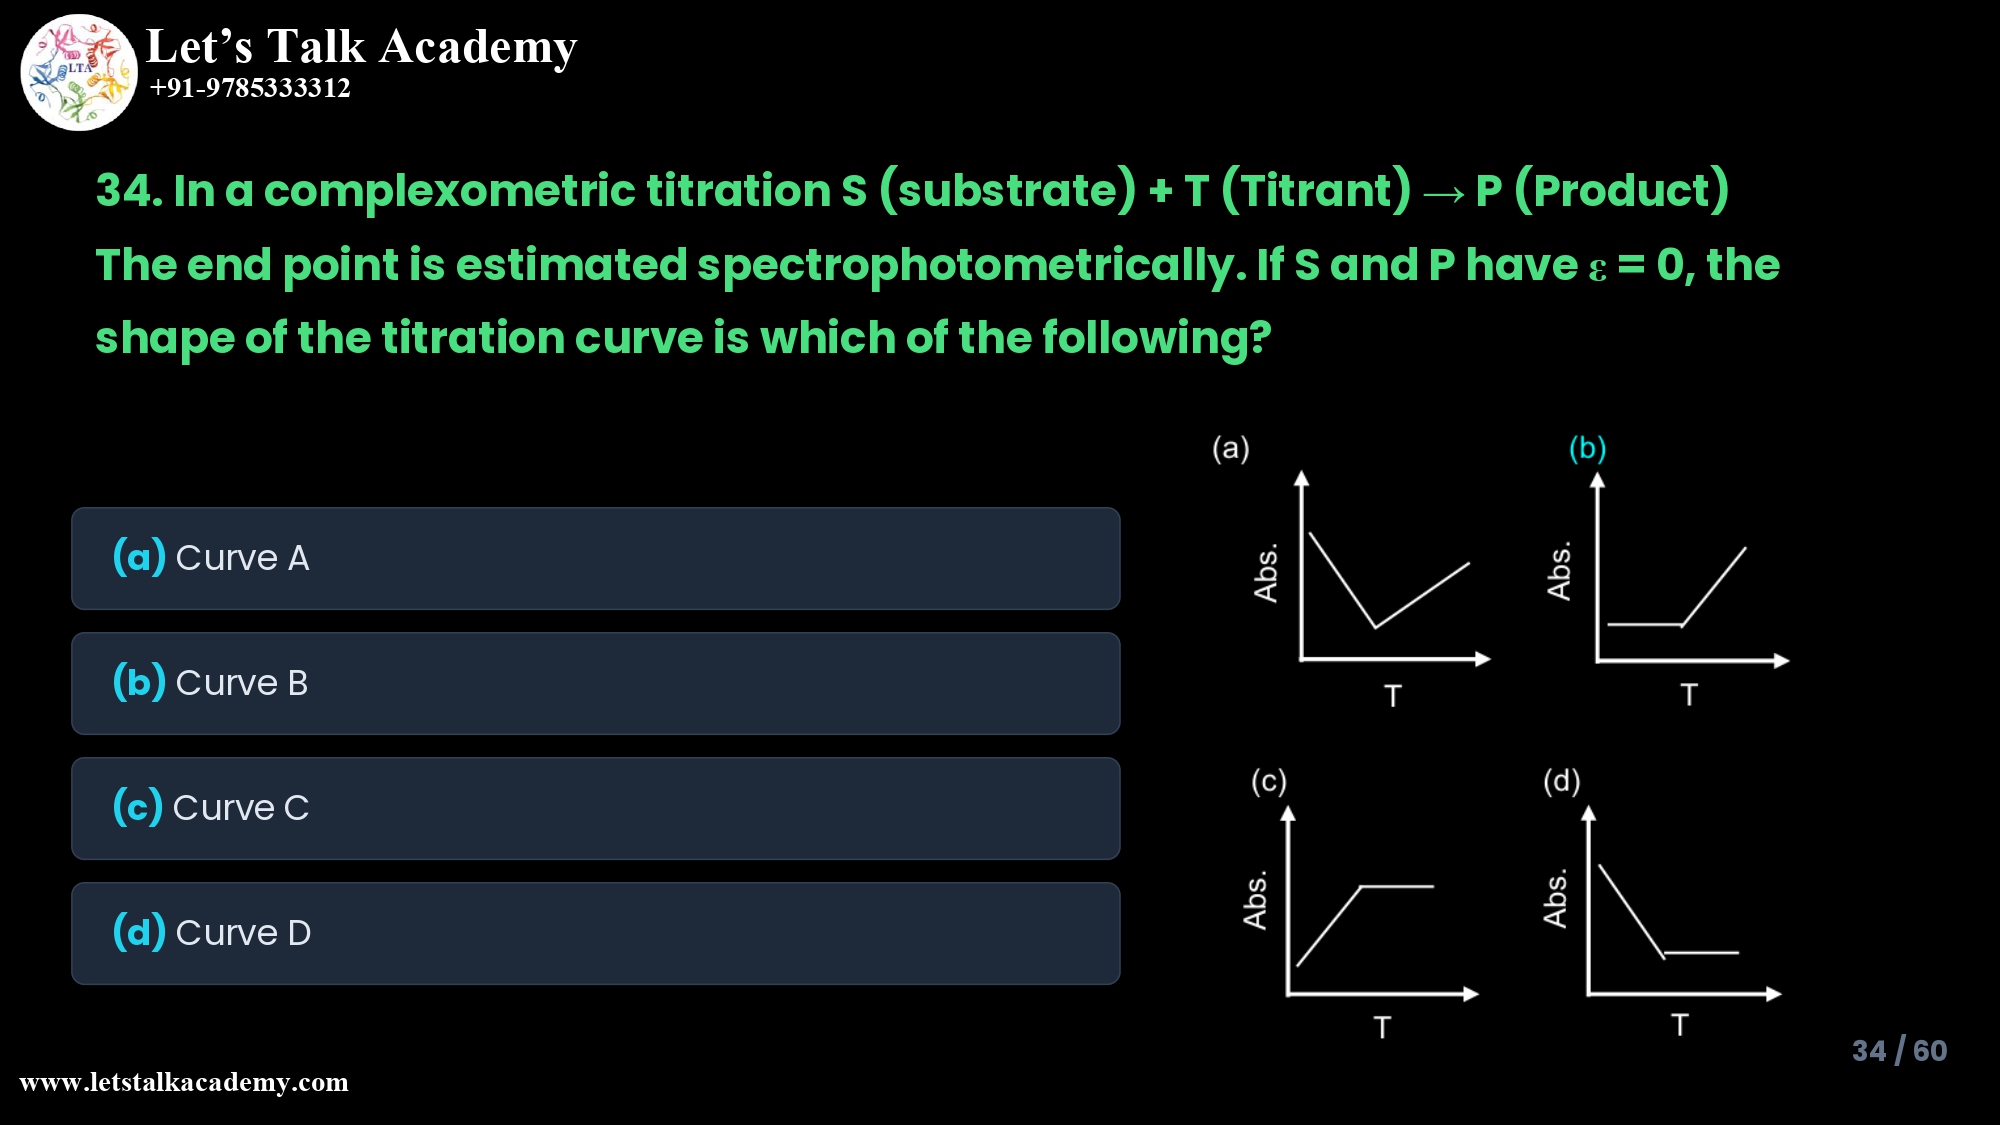
34. In a complexometric titration
S (substrate) + T (Titrant) → P (Product)
The end point is estimated spectrophotometrically. If S and P have ε = 0, the
shape of the titration curve is which of the following?
Spectrophotometric Complexometric Titration Curve When Only Titrant Absorbs (εS = εP = 0)
Introduction
In spectrophotometric complexometric titration, the end point is detected by monitoring absorbance as a function of titrant volume, exploiting the Beer–Lambert law to track at least one absorbing species in the reaction mixture. For the system S + T → P with εS = εP = 0, only the titrant T is colored, so the titration curve shape is fully determined by how much free titrant remains before and after the equivalence point.
Concept and Reasoning
At the selected wavelength, absorbance is given by A = εT · b · [T]free, because both substrate S and product P have zero molar absorptivity.
- Before equivalence: Each increment of titrant is consumed immediately by S to form colorless P, so the concentration of free T in solution is essentially zero and absorbance remains nearly constant (very low).
- At equivalence: All S is converted to P; the first slight excess of titrant now remains unreacted and contributes to absorbance.
- After equivalence: Further additions of T accumulate as free colored titrant, so absorbance increases linearly with the volume of titrant added, giving a straight line with positive slope.
Thus, the plot of Absorbance (A) vs volume of titrant (T) consists of a horizontal (or nearly horizontal) segment up to the equivalence point, followed by a linearly increasing segment after equivalence. This is the classical “only titrant absorbs” spectrophotometric titration curve.
Option-by-Option Explanation
Option (a) Curve A
Curve A shows an initial decrease in absorbance with increasing titrant, followed by an increase after the equivalence point. This pattern is characteristic when both titrand (S) and titrant (T) absorb, but the product (P) does not, or when one absorbing species is replaced by another with lower ε up to equivalence and then colored titrant accumulates.
In the given problem, S and P are colorless with εS = εP = 0, so there is no initial absorbance to decrease; hence Curve A is not compatible with the stated condition. Therefore, Curve A is incorrect.
Option (b) Curve B – Correct
Curve B shows a flat (constant, near-zero) absorbance up to the equivalence point and then a linearly increasing absorbance once excess titrant is present. This is exactly the theoretical curve when only the titrant absorbs and both analyte (S) and product (P) are non‑absorbing at the chosen wavelength.
Up to equivalence, all added T reacts completely, leaving no free colored titrant, so A ≈ 0; beyond equivalence, free T accumulates and A increases proportionally to its concentration. Thus, Curve B correctly represents the spectrophotometric titration curve for S + T → P with εS = εP = 0.
Option (c) Curve C
Curve C shows a linear increase in absorbance from the start, which then becomes constant (plateau) after equivalence. This pattern corresponds to the case where only the reaction product (P) absorbs, while both the titrand (S) and titrant (T) are colorless.
As titrant is added, more absorbing product forms and absorbance rises; once all S is consumed at equivalence, additional T no longer produces more product, so absorbance levels off. Since our system has εP = 0, product is non‑absorbing and cannot give this rising-then-plateau curve; therefore Curve C is not correct here.
Option (d) Curve D
Curve D shows a decrease in absorbance with added titrant, then a low, nearly constant absorbance beyond equivalence. Such a curve is typical when only the titrand (S) absorbs, and both titrant (T) and product (P) do not.
Before equivalence, titrant converts absorbing S to colorless P, so absorbance falls; after equivalence, there is no more S to consume, so absorbance remains at a minimum. In this question, S is explicitly stated to have εS = 0, so S does not absorb, ruling out Curve D.
Summary Table of Curve Types
| Case at Selected Wavelength | Who Absorbs? | Expected A vs T Behavior | Matching Curve |
|---|---|---|---|
| Only titrand (S) absorbs | S only | Decrease to minimum, then constant | Similar to D |
| Only titrant (T) absorbs | T only | Constant (low) up to Veq, then linear increase | B (correct) |
| Only product (P) absorbs | P only | Linear increase to Veq, then plateau | Similar to C |
| Both S and T absorb; P colorless | S and T | Decrease to Veq, then increase | Similar to A |
In the given complexometric titration S + T → P with εS = εP = 0, only titrant T absorbs, so the correct titration curve is Curve B.


