
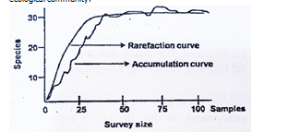
- Given below are the species accumulation curves and rarefaction curves measured in an ecological community.
Which one of the following statements is INCORRECT about the two curves?
(1) Species accumulation curve moves from left to right and rarefaction curve moves from right to left.
(2) Species accumulation curve represents the total species richness of the assemblage.
(3) Rarefaction curve represents the mean of repeated resampling of all pooled samples.
(4) Rarefaction curve is the realized accumulation value of the total species in a community.Accurately measuring biodiversity is a cornerstone of ecological research. Two essential tools in this process are species accumulation curves and rarefaction curves. Both are graphical methods used to estimate and compare species richness, but they serve different purposes and are interpreted in distinct ways. Understanding the differences between these curves is crucial for ecologists and anyone interested in biodiversity studies.
What Are Species Accumulation Curves?
Species accumulation curves plot the cumulative number of species discovered as a function of sampling effort, such as the number of individuals or samples collected. As more samples are added, the curve rises—often steeply at first—and then gradually levels off as fewer new species are encountered. The plateau, or asymptote, indicates that most species in the community have been sampled, and additional effort is unlikely to yield many new species1246.
What Are Rarefaction Curves?
Rarefaction curves are used to standardize and compare species richness between samples of different sizes. They are generated by repeatedly resampling the pooled data and calculating the average number of species expected for a given number of individuals or samples. Rarefaction is an interpolation method, not an extrapolation, and helps estimate the expected species richness for smaller, standardized sample sizes1489.
Comparing the Curves
-
Species accumulation curves show the realized increase in species richness as more samples are added, moving from left to right on the graph.
-
Rarefaction curves represent the mean species richness for a given sample size, typically moving from right to left as the sample size is reduced through resampling14.
Which Statement Is Incorrect?
Let’s review the statements:
-
Species accumulation curve moves from left to right and rarefaction curve moves from right to left.
-
Species accumulation curve represents the total species richness of the assemblage.
-
Rarefaction curve represents the mean of repeated resampling of all pooled samples.
-
Rarefaction curve is the realized accumulation value of the total species in a community.
-
This is incorrect. The rarefaction curve does not show the realized (actual) accumulation of all species in the community; instead, it estimates the expected number of species for a standardized sample size through interpolation, not extrapolation. The species accumulation curve, not the rarefaction curve, reflects the realized accumulation of species1248.
-
Why the Distinction Matters
Misinterpreting these curves can lead to over- or underestimation of biodiversity and flawed comparisons between different studies or habitats. Recognizing that rarefaction curves provide an estimate for standardized sample sizes, and not the actual total species richness, is essential for robust ecological analysis.
Conclusion
Species accumulation and rarefaction curves are powerful tools for biodiversity assessment, but they must be used and interpreted correctly. The incorrect statement is:
“Rarefaction curve is the realized accumulation value of the total species in a community.”
Understanding the true purpose and limitations of each curve ensures accurate ecological research and better conservation decisions. -


3 Comments
Manisha choudhary
October 25, 2025Species accumulation curve = species richness ki actual (realized ) value btata h
Left to right shift hota h too mtlab late plataue (flate ) hua h curve means species richness jyada h ,means sampling incomplete h abhi tk
Curve left to right shift hota h
Species rare fraction curve = jab alag alag jagah p species richness (diversity) dekhna ho or number of individuals alag alag hi tb use krte h
Jaise ek forest m 1000 individual pakde species 80 h
Forest 2 me 500 individual pakde pr species 50 h too direct forest 1 ko High species richness wala khana wrong ho skta h
Estimation krte h
Actual value nhi deta
Curve left and upward shift ho rha h means high species richness
Curve right to left shift hota h
Manisha choudhary
October 25, 2025Highest degree of endemism island m milta h
Santosh Saini
October 28, 2025The rarefaction curve does not show the realized (actual) accumulation of all species in the community , instead it estimates the expected number of species for a standardized sample size through interpolation not extra polation.