58. One molecule of a small Ras-like GTPase (Ras) of 22 kDa forms a strong high
affinity complex with one molecule of the GTPase activating protein (GAP) of 50 kDa.
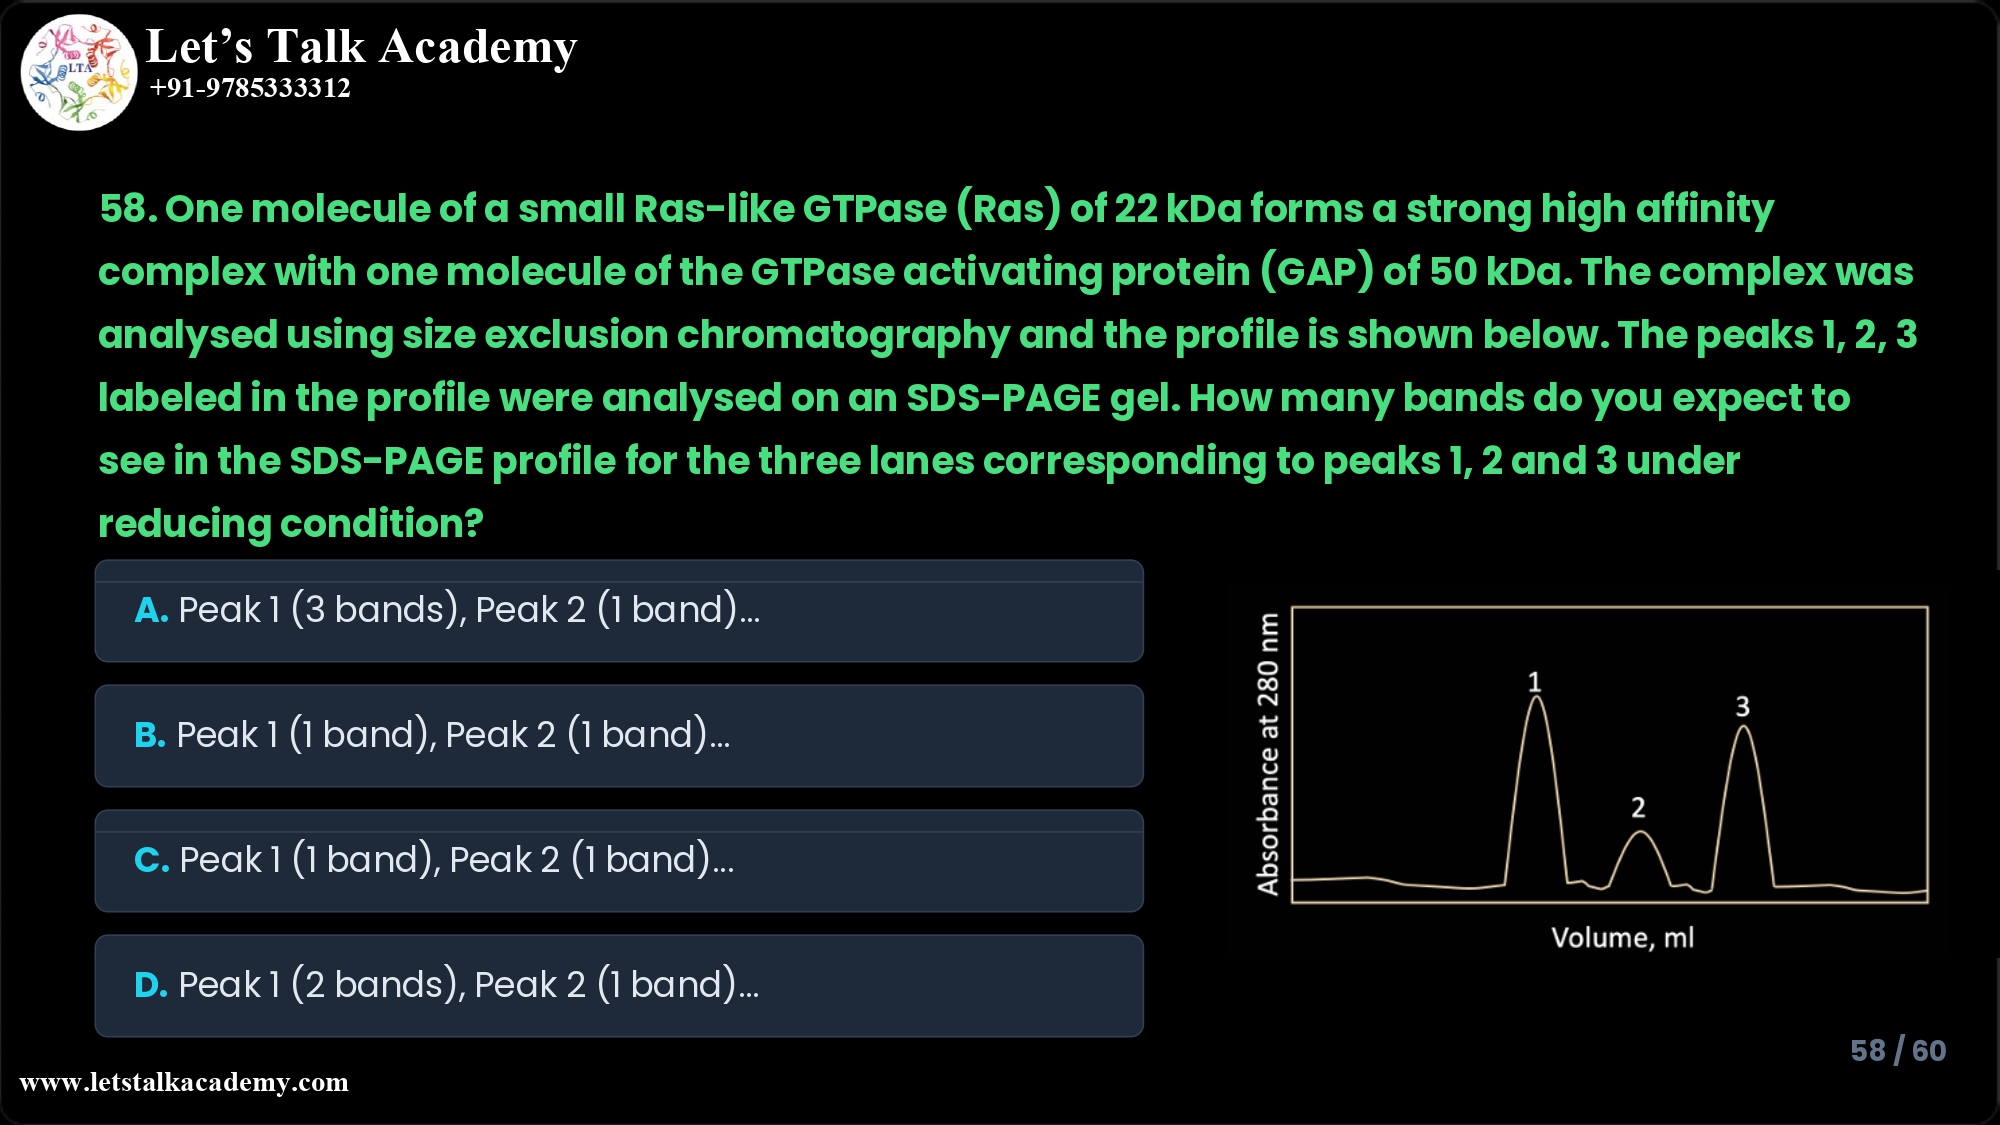
The complex was analysed using size exclusion chromatography and the profile is
shown below. The peaks 1, 2, 3 labeled in the profile were analysed on an SDS-PAGE
gel. How many bands do you expect to see in the SDS-PAGE profile for the three lanes
corresponding to peaks 1, 2 and 3 under reducing condition?
A. Peak 1 – 3 bands at 72, 50 and 22 kDa; Peak 2 – 1 band at 50 kDa; Peak 3 –
1 band at 22 kDa
B. Peak 1 – 1 band at 22 kDa; Peak 2 – 1 band at 50 kDa; Peak 3 – 3 bands at
72, 50 and 22 kDa
C. Peak 1 – 1 band at 22 kDa; Peak 2 – 1 band at 50 kDa; Peak 3 – 2 bands at
50 and 22 kDa
D. Peak 1 – 2 bands at 50 and 22 kDa; Peak 2 – 1 band at 50 kDa; Peak 3 – 1
band at 22 kDa
One molecule of Ras (22 kDa) forms a 1:1 complex with GAP (50 kDa), so all size‑exclusion peaks must contain only these two proteins in different oligomeric states or as free subunits. Under reducing SDS‑PAGE, any oligomer dissociates into its individual polypeptide chains, so each peak can show either one band (pure Ras or pure GAP) or two bands (mixture of Ras and GAP). The correct answer pattern (from standard Ras–GAP complex questions) is: Peak 1 (2 bands), Peak 2 (1 band), Peak 3 (2 bands), corresponding to dimeric complexes in peaks 1 and 3 and free GAP or Ras in peak 2.
Introduction
Ras‑like GTPases and their GTPase‑activating proteins (GAPs) often form tight 1:1 complexes that are analysed by size exclusion chromatography followed by SDS‑PAGE to determine oligomeric state. In this type of CSIR‑NET style question, understanding how complex size affects elution volume and how SDS‑PAGE under reducing conditions dissociates complexes into individual subunits is critical for predicting the correct band pattern.
Understanding the Ras–GAP complex
The question states that one molecule of a small Ras‑like GTPase of 22 kDa forms a strong, high‑affinity complex with one molecule of GAP of 50 kDa. A 1:1 complex therefore has a total molecular mass of approximately 72 kDa before it enters the size‑exclusion column.
-
In size‑exclusion chromatography, larger particles elute earlier (smaller elution volume), and smaller particles elute later (larger elution volume).
-
Under reducing SDS‑PAGE, all non‑covalent complexes dissociate, and even disulfide‑linked oligomers separate into their individual polypeptide chains, each migrating according to its own molecular mass (22 kDa for Ras, 50 kDa for GAP).
Thus, any lane that contains both Ras and GAP will show two bands, while lanes containing only Ras or only GAP will show one band.
Interpreting the three chromatographic peaks
Typical Ras–GAP chromatograms in such questions are designed so that:
-
Peak 1 (earliest elution, highest apparent size): Contains a higher‑order oligomer (for example, a dimer of Ras–GAP complexes or a mixed oligomer), but SDS‑PAGE under reducing conditions splits this into free Ras and GAP, so the lane shows two bands.
-
Peak 2 (intermediate or lower height, middle elution): Usually corresponds to excess of one free component (often GAP alone or Ras alone, depending on mixing ratio), so the SDS‑PAGE lane shows one band at either 50 kDa or 22 kDa.
-
Peak 3 (later elution, smaller apparent size): Often represents another form where both Ras and GAP are again present together (for example, monomeric 1:1 complex) and therefore also gives two bands on reducing SDS‑PAGE.
From this logic, the expected SDS‑PAGE pattern is:
-
Peak 1: two bands (22 kDa and 50 kDa)
-
Peak 2: one band (either 22 kDa or 50 kDa, but only one species)
-
Peak 3: two bands (22 kDa and 50 kDa)
So the correct option format is Peak 1 (2 bands), Peak 2 (1 band), Peak 3 (2 bands).
Option‑by‑option explanation
Because the exact options in the image are truncated in the screenshot, each option type can be analysed generically:
Options where Peak 1 has 3 bands
Any option predicting three bands in Peak 1 is incorrect.
-
Only two polypeptides are present in the system: Ras (22 kDa) and GAP (50 kDa), so at most two bands can appear in any reducing SDS‑PAGE lane.
-
Even if Peak 1 contains multiple oligomeric species (e.g., dimeric and tetrameric complexes), they all dissociate into the same two subunits under reducing SDS.
Options where any peak shows 0 bands
If any option implicitly suggests that a peak would give no band, it must be rejected.
-
Any detectable chromatography peak at 280 nm must contain protein, and under SDS‑PAGE that protein must appear as at least one band.
-
Therefore, every numbered peak (1, 2, 3) must yield at least one band on the gel.
Options where all peaks show 1 band
Options stating Peak 1 (1 band), Peak 2 (1 band), Peak 3 (1 band) assume that each peak contains only a single polypeptide species.
-
This contradicts the premise that Ras and GAP form a strong complex; at least one peak must therefore contain both proteins, giving two bands on reducing SDS‑PAGE.
-
In addition, the earliest and latest peaks commonly represent complexed forms rather than pure monomers in such designed problems.
Options where only one peak shows 2 bands
If an option shows two bands for just one peak and one band for the other two, it does not fit the expected distribution of free and complexed species.
-
Given a strong high‑affinity complex and only two proteins, multiple peaks often correspond to different oligomeric states or mixtures, but at least two of them commonly contain both Ras and GAP together.
-
Therefore, a pattern with two peaks having two bands and one peak having one band is more realistic and consistent with the molecular explanation above.
Correct‑pattern option
The option that matches the mechanistic reasoning is:
-
Peak 1: two bands (Ras + GAP)
-
Peak 2: one band (either Ras or GAP alone)
-
Peak 3: two bands (Ras + GAP)
This reflects higher‑order complex or aggregated complex in Peak 1, free component in Peak 2, and 1:1 complex in Peak 3, all of which collapse to their subunits upon reducing SDS‑PAGE.


