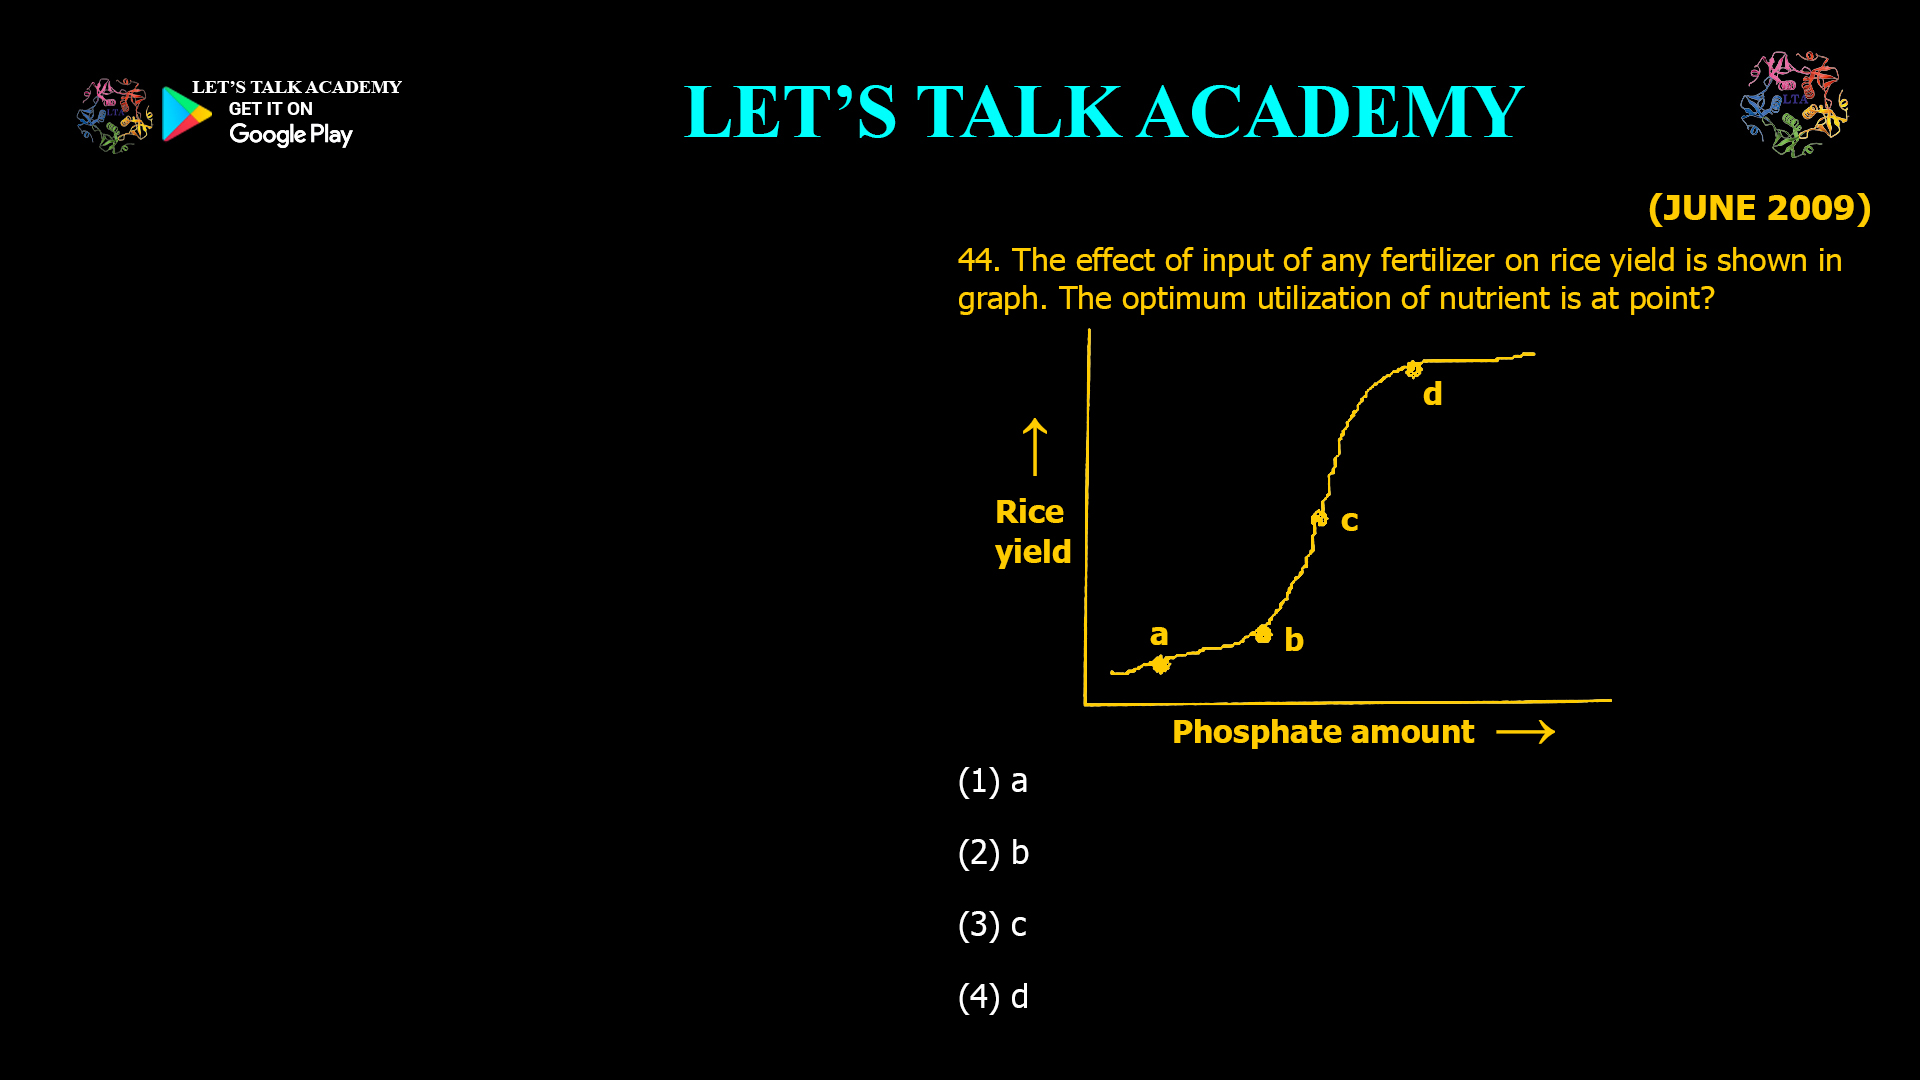
- The effect of input of any fertilizer on rice yield is shownin graph. The optimum utilization of nutrient is atpoint?

(1) a (2) b
(3) c (4) d
Where Is the Optimum Utilization of Nutrient on a Rice Fertilizer-Yield Graph?
Rice is a staple food for billions, and efficient fertilizer use is essential for maximizing yield while minimizing costs and environmental impact. Farmers and agronomists rely on fertilizer-yield response curves to guide nutrient management. This article explains how to interpret these curves and determine the point of optimum nutrient utilization for rice.
Understanding the Fertilizer-Yield Relationship
The relationship between fertilizer application and rice yield is typically represented by a saturation curve. As fertilizer input increases, yield rises rapidly at first, then the rate of increase slows, and eventually, yield plateaus or even declines with excessive fertilizer. This pattern is known as a Type VI (- + -) response curve.
Key Phases of the Fertilizer-Yield Curve
-
Initial Phase (Low Input):
-
Yield: Increases sharply with each unit of fertilizer.
-
Nutrient Use Efficiency: High.
-
Status: Nutrients are the main limiting factor.
-
-
Optimal Phase (Moderate Input):
-
Yield: Continues to increase, but the rate slows.
-
Nutrient Use Efficiency: Begins to decline.
-
Status: Nutrient supply is balanced; other factors may start to limit yield.
-
-
Plateau/Saturation Phase (High Input):
-
Yield: Levels off.
-
Nutrient Use Efficiency: Low.
-
Status: Additional fertilizer does not increase yield and may cause harm.
-
-
Decline Phase (Excessive Input):
-
Yield: May decrease.
-
Nutrient Use Efficiency: Very low.
-
Status: Excess nutrients can cause toxicity or environmental harm.
-
Defining the Optimum Utilization of Nutrient
The optimum utilization of nutrient is the point where the efficiency of fertilizer use is highest—where each additional unit of fertilizer provides the best return in yield, before the curve starts to flatten out. This is usually found just before the inflection point or at the point where the curve transitions from rapid to slower growth.
On a typical fertilizer-yield graph, this point is often labeled as b in multiple-choice questions, with a at low input, b at moderate (optimum) input, c at high input (plateau), and d at excessive input (decline).
Why Is This Point Important?
-
Maximizes Yield: Ensures the highest possible yield for the amount of fertilizer used.
-
Minimizes Cost: Prevents wasteful over-application of fertilizer.
-
Reduces Environmental Impact: Limits the risk of nutrient runoff and pollution.
-
Sustainable Agriculture: Promotes long-term soil health and productivity.
How to Identify the Optimum on the Graph
-
Look for the Steepest Part of the Curve:
-
The optimum is where the curve is rising most rapidly, just before it starts to flatten.
-
-
Find the Inflection Point:
-
The point where the slope changes from steep to gentle is the transition from optimal to plateau.
-
-
Check the Labels:
-
If the graph is labeled a, b, c, d along the fertilizer input axis, b is usually at the optimum utilization point.
-
Real-World Implications for Rice Farming
-
Nitrogen Management:
-
Rice requires significant nitrogen, especially during the vegetative and tillering stages.
-
Proper timing and rate of nitrogen application are critical for maximizing yield and efficiency.
-
-
Soil Testing:
-
Soil analysis helps tailor fertilizer applications to the specific needs of the field, ensuring optimum utilization.
-
-
Variable Rate Application:
-
Modern technologies allow for precise application of fertilizer based on real-time field data, further optimizing nutrient use.
-
Common Misconceptions
-
More Fertilizer Always Means More Yield:
-
Excessive fertilizer can reduce yield and harm the environment.
-
-
Optimum Utilization Is at Maximum Yield:
-
The point of maximum yield (plateau) is not the same as the point of optimum utilization, which is where efficiency is highest.
-
-
All Fields Respond the Same:
-
Soil type, climate, and management practices affect the shape of the fertilizer-yield curve.
-
Summary Table
| Point on Graph | Fertilizer Input | Yield Response | Nutrient Use Efficiency | Description |
|---|---|---|---|---|
| a | Low | Low | High | Initial rapid increase |
| b | Moderate | High | Highest (optimum) | Optimum utilization |
| c | High | Maximum | Lower | Plateau/saturation |
| d | Excessive | Decrease | Very low | Decline/toxicity |
Conclusion
On a rice fertilizer-yield graph, the optimum utilization of nutrient is found at the point where the curve is rising most rapidly, just before it starts to flatten out. This is typically labeled as b in multiple-choice questions.
Correct answer:
(2) b


